
Convert 2D image to QSurface3D Polar Data Model?
-
We are migrating from rendering our data as a rapidly updating QIMage to entirely use QTDataVisualization modules instead. After many hours I some need help getting the polar-graph to display correctly. Using QSurface3D and 'polar=true'.
Data is received as a QByteArray representing a 128x128 matrices with values of 0-254. The data is organized such that when mapped directly to a QImage, assigning each pixel a RGB color ( X, 0, 0) where 'X' is the data-point's value, the result is the final image to be displayed on the Polar Graph. Previously we were doing exactly this and overlaying a *.png of the polar grid. So I effectively have to re-map a finished 2D Cartesian image into a Polar Data-Model. How can this be done correctly?
Currently I can stream the data into my QSurface3D and in Orthographic/Cartesian mode the data looks correct. After setting 'Polar: true', obviously the data is warped around the circle. I need to see on the Polar view, what I currently see on the Cartesian view instead. What is the proper method to convert the data?
The following code is not bringing me anywheres close. I'm prototyping inside the QMLOscilloscope example. Can anyone please help?
void DataSource::composePolarData() {
    if (! m_data.size()) { return; }
    m_index++;
    if (m_index > m_data.count() - 1)
        m_index = 0;

    QSurfaceDataArray array = m_data.at(m_index);
    quint8 *ptr = (quint8 *)m_ourData.constData();
    float value {0.0f};         // originally:  quint8 value {0};
    for(auto z{0}; z < 128; ++z) {
        QSurfaceDataRow &row = *(array[z]);
        for(auto x {0}; x < 128; ++x) {
            auto rowOffset = (127-z)*128;
            value = ptr[x + rowOffset];         // Value from original grid at coords: y=(x,z)

#define _TEST2_
#ifdef _TEST1_
                qint32 xo = x - 64;          // -32;
                qint32 zo = z - 64;
                float radius {0};
                float angle  {0};
                radius = std::round(std::hypot(xo, zo));            // sqrt(x^2 + z^2);
                angle =  std::round(std::atan2(zo, xo));            // tan^-1(z/x)
                (*array[radius])[abs(angle)] = QVector3D(x, value, z);      // Interesting but wrong result.
#endif
#ifdef _TEST2_
                float xo = x - 64.0f;   // -32;
                float zo = z - 64.0f;
                float radius {0.0f};
                float angle  {0.0f};
                radius = std::hypot(xo, zo);            // sqrt(x^2 + z^2);
                angle =  std::atan2(zo, xo);            // tan^-1(z/x)

    /*1*/       row[x] = QVector3D(angle, value, radius);           // Polar Graph .. #Fail
//  /*2*/       (*array[z])[x] = QVector3D(angle, value, radius);   // Polar Graph .. #Fail

//  /*3*/       row[x] = QVector3D(x, value, z);            // Beautiful but useless Cartesian View of "should be" Polar Data.
//  /*4*/       (*array[z])[x] = QVector3D(x, value, z);    // Beautiful but useless Cartesian View of "should be" Polar Data.
#endif
                // 1)   Displays empty graphs. Crashes when clicking 'Show Surface'
                // 2)   Displays empty graphs. Crashes when clicking 'Show Surface'
                // 3)   Shows the original image as received when rendered directly to non-polar surface;
                // 4)   Shows the original image as received when rendered directly to non-polar surface;
        }
    }
}
.
And called from example's update() method, slightly stripped down.
.void DataSource::update(QSurface3DSeries *series) { if (series && m_data.size()) { // Each iteration uses data from a different cached array // m_index++; // if (m_index > m_data.count() - 1) // m_index = 0; QSurfaceDataArray array = m_data.at(m_index); int newRowCount = array.size(); int newColumnCount = array.at(0)->size(); // If the first time or the dimensions of the cache array have changed, // reconstruct the reset array if (m_resetArray || series->dataProxy()->rowCount() != newRowCount || series->dataProxy()->columnCount() != newColumnCount) { m_resetArray = new QSurfaceDataArray(); m_resetArray->reserve(newRowCount); for (int i(0); i < newRowCount; i++) m_resetArray->append(new QSurfaceDataRow(newColumnCount)); } composePolarData(); /* <== Call Our Function Here! */ // Copy items from our cache to the reset array for (int i(0); i < newRowCount; i++) { const QSurfaceDataRow &sourceRow = *(array.at(i)); QSurfaceDataRow &row = *(*m_resetArray)[i]; for (int j(0); j < newColumnCount; j++) row[j].setPosition(sourceRow.at(j).position()); } series->dataProxy()->resetArray(m_resetArray); } } -
UPDATE
Still not 100% but visually it appears I've made a big leap forward using this formula.
float xo = x - 64.0f;
float zo = z - 64.0f;
float radius {0.0f};
float angle  {0.0f};
radius = std::hypot(xo, zo);
angle =  std::atan2(zo, xo) * (180/M_PI);
angle = (std::abs(angle));
row[x] = QVector3D(angle, value, radius);
Two important changes were made.
-
A more careful reading of cppReference.com: std::atan2 reveals the return value of atan2() is radians.
-
Furthermore within QT: negative degrees are not allowed.
No, negative angles are not allowed. ~ @beecksche
https://forum.qt.io/topic/69386/change-direction-of-polar-data-visualization/9As for representing
PIin C++A little-known feature of C++ is that the cmath library actually provides many mathematical constants. ... To include the mathematical constants, you need to use a #define macro called _USE_MATH_DEFINES and add it before importing the cmath library:
#define _USE_MATH_DEFINES
#include <cmath>
#include <iostream>

int main() {
std::cout << M_PI << " " << M_E << " " << M_SQRT2 << endl;
return 0;
}
https://www.quantstart.com/articles/Mathematical-Constants-in-C
(emphasis added by me).
-
-
Major progress but really at a loss now. The polar graph is overlapping it'self by 135 degrees, wrapping around too far. Turning on the surface mesh shows exactly what's happening - except I don't know what it means or how to fix it. Does anyone know what the QT engine could be doing here?
Original data is 128x128 (with 'Y' values of 0-256). In the final line I set 'Y' to zero to hide our data. And I'm prototyping inside the original QT 5.8 QMLOscilloscope demo.
This is the full function for the same code from yesterday.
void DataSource::composePolarData() {
    if (! m_data.size()) { return; }
    m_index++;
    if (m_index > m_data.count() - 1)
        m_index = 0;

    QSurfaceDataArray array = m_data.at(m_index);
    quint8 *ptr = (quint8 *)m_ourData.constData();
    float value {0.0f};
    for(auto z{0}; z < 128; ++z) {
        QSurfaceDataRow &row = *(array[z]);
        for(auto x {0}; x < 128; ++x) {
            auto rowOffset = (127-z)*128;
            value = ptr[x + rowOffset];         // Value from original grid at coords: y=*(x,z)

            float xo = x - 64.0f;
            float zo = z - 64.0f;
            float radius {0.0f};
            float angle  {0.0f};
            radius = std::hypot(xo, zo);               // sqrt(x^2 + z^2);
            angle =  std::atan2(zo, xo) * (180/M_PI);  // tan^-1(z/x) [radians] 180/pi [degrees]
            angle = (std::abs(angle));

//            angle = std::fmod(angle, 360);
//            if (angle < 0.0)
//                angle += 180;

//            row[x] = QVector3D(angle, value , radius);   // sanitizing data for the internet.
            row[x] = QVector3D(angle, 0 , radius);
        }
    }
}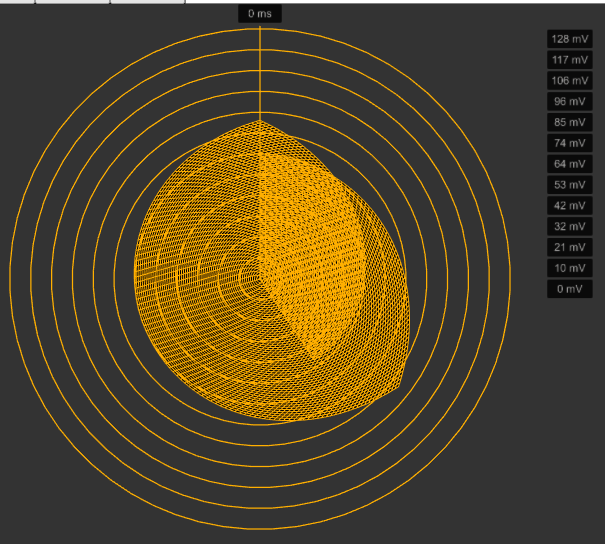
-
Resolution:
The final puzzle piece was in the QML. I had to set the max x, y, z axis values appropriately for a polar graph which differed from the original square-image values.axisX.min: 0 axisY.min: 0 axisZ.min: 0 axisX.max: 360 // [Degrees] axisY.max: 256 // Max data value axisZ.max: 90 // Max calculated radiusFinal c++ was:
float xo = x - 64.0f;
float zo = z - 64.0f;
float radius {0.0f};
float angle  {0.0f};
radius = std::hypot(xo, zo);
angle =  std::atan2(zo, xo) * (180/M_PI);
angle +=90;

angle = std::fmod(angle, 360);
if (angle < 0.0)
    angle += 360;

row[x] = QVector3D(angle, value, radius);