
QtGraphs: GraphsView shifted when plotting more than one LineSeries
-
Hello,
i am seeing a strange shift when adding more than one LineSeries to a GraphsView.
The View gets shifted to the right by about 10% of the xaxis range, and the tickmarks on the x and y-axis also get displaced. When commenting out the second LineSeries the GraphsView looks fine.A minimal example is below, problem occurs under Qt 6.11.
Am I doing something wrong, or is this a bug in QtGraphs ?I would be thankful for any hints on this,
Markus
Main.qml:
import QtQuick
import QtGraphs

Window {
    width: 1024
    height: 768
    visible: true
    title: qsTr("Hello World")

    GraphsView {
        anchors.fill: parent
        LineSeries {
            id:series1
            axisX: xaxis
            axisY: yaxis
            color: "#ff0000"
            ValueAxis {
                id: xaxis
                min: 0
                max: 1
            }
            ValueAxis {
                id: yaxis
                min: 0
                max: 1
            }
            XYPoint {
                x:0
                y:0
            }
            XYPoint {
                x:1
                y:1
            }
        }
        LineSeries {
            id:series2
            axisX: xaxis
            axisY: yaxis
            color: "#00ff00"
            XYPoint {
                x:0
                y:1
            }
            XYPoint {
                x:1
                y:0
            }
        }
    }
}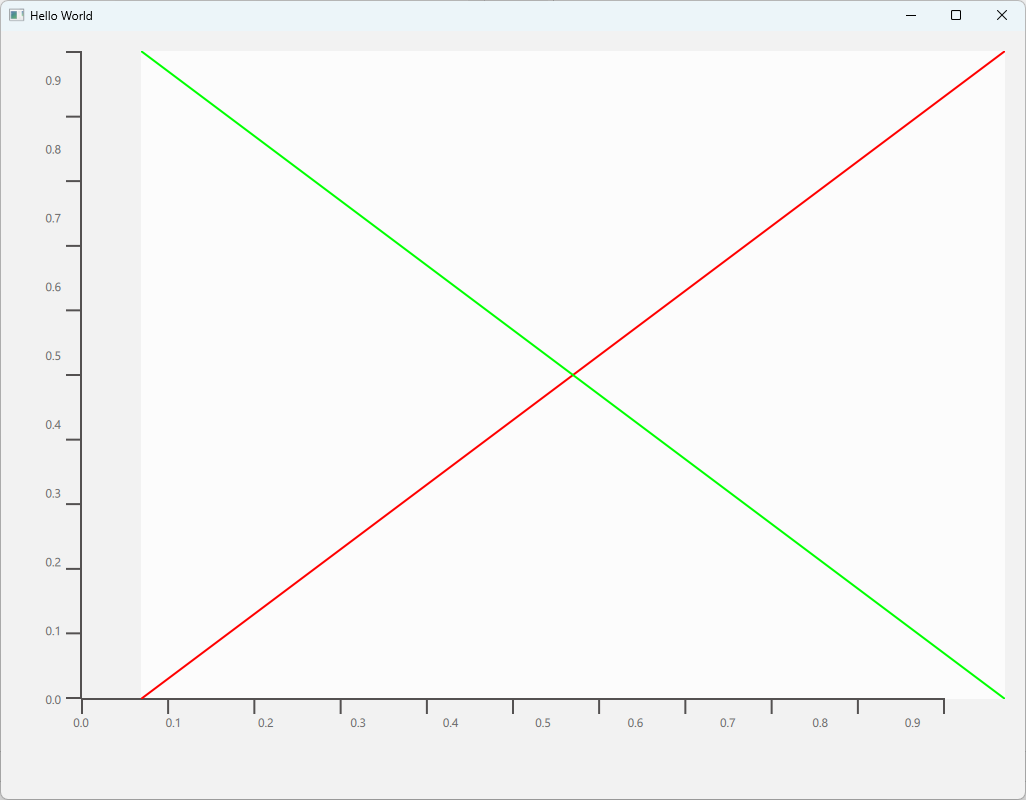
-
OK, so looking at the hellographs example, it looks like for more than one Series per GraphsView, axisX and axisY have to be defined in the GraphsView, and not in the Series.
If anyone from Qt is reading this, can you please, please update the docs in
https://doc.qt.io/qt-6/qml-qtgraphs-scatterseries.html
which do not describe this correctly.
Thanks, Markus
-
M mweiss has marked this topic as solved on
-
Hi,
This is possible but you are welcome to submit a patch to fix the documentation :-)
-
So it looks like it was a bug in QtGraphs, which was fixed in 6.11.1:
https://qt-project.atlassian.net/browse/QTBUG-144579
The documentation is correct as is, no need to update.Thanks, Markus
-
Nice !
Thanks for the follow-up :-)