
QChart Range / TickCount Question
-
I have a report from the field on 5.12.x on a chart.
I have the following code with a file with maxTime = 106.4 and printerTimeScale = 0 (1min blocks).
            // *** Chart Area ***
            int numBlocks = 0;
            switch(printerTimeScale) {
            default:
            case 0:
                numBlocks = static_cast<int>(maxTime) + 1;
                break;
            case 1:
                numBlocks = static_cast<int>(maxTime/2.0 + (static_cast<int>(maxTime) % 2) + 1);
                break;
            case 2:
                numBlocks = static_cast<int>(maxTime/5.0 + (static_cast<int>(maxTime) % 5) + 1);
                break;
            }

            reinterpret_cast<QValueAxis*>(chart.axes()[0])->setTickCount(numBlocks + 1);
            reinterpret_cast<QValueAxis*>(chart.axes()[0])->setRange(0.0, numBlocks*((printerTimeScale == 0) ? 1.0 : (printerTimeScale == 1) ? 2.0 : 5.0));
The data ends at 106.4 minutes as expected and the last column #107 runs from 107.0 to 108.0.
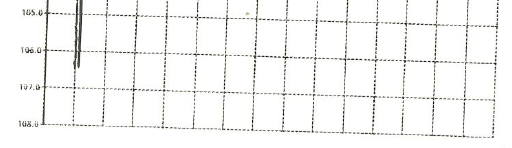
All good so far. However, if I go to day column #40 it runs from 39.4 to 40.4...why?
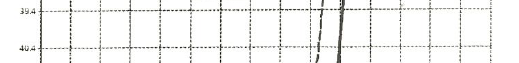
Where is this decimal coming from?
Thanks,
-Rich -
Hi,
Can you compare that behaviour to a more recent version of Qt ? At least 5.15.
-
I have a report from the field on 5.12.x on a chart.
I have the following code with a file with maxTime = 106.4 and printerTimeScale = 0 (1min blocks).
            // *** Chart Area ***
            int numBlocks = 0;
            switch(printerTimeScale) {
            default:
            case 0:
                numBlocks = static_cast<int>(maxTime) + 1;
                break;
            case 1:
                numBlocks = static_cast<int>(maxTime/2.0 + (static_cast<int>(maxTime) % 2) + 1);
                break;
            case 2:
                numBlocks = static_cast<int>(maxTime/5.0 + (static_cast<int>(maxTime) % 5) + 1);
                break;
            }

            reinterpret_cast<QValueAxis*>(chart.axes()[0])->setTickCount(numBlocks + 1);
            reinterpret_cast<QValueAxis*>(chart.axes()[0])->setRange(0.0, numBlocks*((printerTimeScale == 0) ? 1.0 : (printerTimeScale == 1) ? 2.0 : 5.0));
The data ends at 106.4 minutes as expected and the last column #107 runs from 107.0 to 108.0.
All good so far. However, if I go to day column #40 it runs from 39.4 to 40.4...why?
Where is this decimal coming from?
Thanks,
-Rich@Rich-Bair said in QChart Range / TickCount Question:
107.0 to 108.0.
Maybe, it's about
void QValueAxis::setRange(qreal min, qreal max)
setTickInterval(qreal insterval)
or you can check with these
void QValueAxis::minChanged(qreal min)
void QValueAxis::maxChanged(qreal max)
tickIntervalChanged(qreal interval)
Because your code its calculate true.
int getNum(int printerTimeScale, double maxTime){ int numBlocks = 0; switch(printerTimeScale) { default: case 0: numBlocks = static_cast<int>(maxTime) + 1; break; case 1: numBlocks = static_cast<int>(maxTime/2.0 + (static_cast<int>(maxTime) % 2) + 1); break; case 2: numBlocks = static_cast<int>(maxTime/5.0 + (static_cast<int>(maxTime) % 5) + 1); break; } return numBlocks; } double maxTime = 106.4; qDebug() << "getNum 0" << getNum(0, maxTime); //getNum 0 107 qDebug() << "getNum 1" << getNum(1, maxTime); //getNum 1 54 qDebug() << "getNum 2" << getNum(2, maxTime); //getNum 2 23 maxTime = 39.4; qDebug() << "getNum 0" << getNum(0, maxTime); //getNum 0 40 qDebug() << "getNum 1" << getNum(1, maxTime); //getNum 1 21 qDebug() << "getNum 2" << getNum(2, maxTime); //getNum 2 12 -
I tested on windows 5.12.12 and 6.10.2...no joy. The only way I can make the symptom appear is if I do something like change the range with the multiplier:
int numBlocks = 0; switch(printerTimeScale) { default: case 0: numBlocks = static_cast<int>(maxTime) + 1; break; case 1: numBlocks = static_cast<int>(maxTime/2.0 + (static_cast<int>(maxTime) % 2) + 1); break; case 2: numBlocks = static_cast<int>(maxTime/5.0 + (static_cast<int>(maxTime) % 5) + 1); break; } reinterpret_cast<QValueAxis*>(chart.axes()[0])->setTickCount(numBlocks + 1); reinterpret_cast<QValueAxis*>(chart.axes()[0])->setRange(0.0, numBlocks*((printerTimeScale == 0) ? **1.01** : (printerTimeScale == 1) ? 2.0 : 5.0)); -
How much does it affect you if the graph's boundaries grow by one unit? If the graph is drawn correctly, there shouldn't be a problem.