
QChart update performance when adding QXYSeries::PointConfiguration
-
I have a screen with three QCharts displaying raw data that comes from a server. On receiving several seconds of data (2K-4K points) I need to update the chart with certain regions highlighted using
QXYSeries::PointConfiguration
I gather the actual data points into a QList<QpointF> then call
QLineSeries::replace(QList<QPointF>)
Then I need to highlight several regions of data. I have not found a similar method like the replace function what will apply the configuration in one go, perhaps being faster.
Here is some pseudo code to give an idea what I am doing:
First is a method to gather the data from the raw data structure (TDADataMap):void Realtimeplot0::FinishPlot(TDADataMap *pDataMap, short srsct) { MultiLineSeries *thisSrs = GetLineSeries(srsct);// handles getting specific LineSeries stored in the class // Get the raw data structures to pull data from // plotx and ploty are integers set elsewhere TDADataList *pDataListx = pDataMap->find(plotx); TDADataList *pDataListy = pDataMap->find(ploty); quint32 ct = pDataListy->size(); quint32 curpos=0; qreal tmpx, tmpy; QList<QPointF> fnshlst; while (curpos < ct){ ptry = (*pDataListy)[unsigned(curpos)]; ptrx = (*pDataListx)[unsigned(curpos)]; tmpx = ptrx.GetTimeSec(); tmpy = ptry.GetRealValue(); fnshlst.append(QPointF(tmpx,tmpy); curpos++; } thisSrs->appendData(fnshlst); if (!m_brthPosns.isEmpty()) // sets colors for the given QLineSeries setBrthColors(srsct); }Here is outline of the class method to set colors:
void Realtimeplot0::MultiLineSeries::setBrthColors(short srsct){
    QHash<QXYSeries::PointConfiguration, QVariant> conf;
    conf[QXYSeries::PointConfiguration::Color] = QColor(Qt::darkYellow);
    conf[QXYSeries::PointConfiguration::Size] = 1;
    conf[QXYSeries::PointConfiguration::LabelVisibility] = false;

    MultiLineSeries *thisSrs = GetLineSeries(srsct);
    // we iterate into the class object
    m_brthPosns:QList<BrthPosnPlots>::iterator brthItr = m_brthPosns.begin();
    // grab the data from the series:
    QList<QPointF> srspts = thisSrs->points();
    quint32 ctSrs = srspts.size();
    unsigned bpos;
    for (brthItr = m_brthPosns.begin(); brthItr != m_brthPosns.end(); brthItr++) {
        for (bpos = (*brthItr).GetEIPos(); bpos < (*brthItr).GetEEPos(); bpos++) {
            thisSrs->setPointConfiguration(bpos, conf);
    }

}
My question is: is there a way to collect the conf objects into a QList or something like to submit to the QLineSeries-derived class?
Or any other suggestions to speed this up. The appendData method takes 20 msec, but the setBrthColors takes nearly 2 sec for a set of about 3K data points.
Here is screen shot of one of the three QCharts that gets colored:
-
Thanks, solution found, similar to what you are suggesting.
I dug a bit further into Qt docs and found the entry for setPointsConfiguration, which takes data in the form ofQHash<int, QHash<QXYSeries::PointConfiguration, QVariant>>So my new code for setting the colors looks like:
        QHash<int, QHash<QXYSeries::PointConfiguration, QVariant>> ptsConfig;
        QList<BrthPosnPlots>::iterator brthItr = m_brthPosns.begin();
        MultiLineSeries *thisSrs = GetLineSeries(srs);

        QList<QPointF> srspts = thisSrs->points();
        quint32 ctSrs = srspts.size();
        if ((ctSrs < 1))
            return;
        qsizetype bpos;
        for (brthItr = m_brthPosns.begin(); brthItr != m_brthPosns.end(); brthItr++) {
            if ((*brthItr).GetEEPos() > ctSrs)
                continue;
            if (((*brthItr).GetEIPos() > 1) && ((*brthItr).GetEEPos() > (*brthItr).GetEIPos() + 5)) {
                for (bpos = (*brthItr).GetEIPos(); bpos < (*brthItr).GetEEPos(); bpos++) {
                    ptsConfig.insert_or_assign(bpos, conf);
                    // thisSrs->setPointConfiguration(bpos, conf);
                }
            }
        }
        if (!ptsConfig.isEmpty()) {
            thisSrs->setPointsConfiguration(ptsConfig);
        }
The speedup is truly amazing! From over 2 sec down to < 20 msec for this method.
Thanks to all for feedback and tips. -
I have a screen with three QCharts displaying raw data that comes from a server. On receiving several seconds of data (2K-4K points) I need to update the chart with certain regions highlighted using
QXYSeries::PointConfiguration
I gather the actual data points into a QList<QpointF> then call
QLineSeries::replace(QList<QPointF>)
Then I need to highlight several regions of data. I have not found a similar method like the replace function what will apply the configuration in one go, perhaps being faster.
Here is some pseudo code to give an idea what I am doing:
First is a method to gather the data from the raw data structure (TDADataMap):void Realtimeplot0::FinishPlot(TDADataMap *pDataMap, short srsct) { MultiLineSeries *thisSrs = GetLineSeries(srsct);// handles getting specific LineSeries stored in the class // Get the raw data structures to pull data from // plotx and ploty are integers set elsewhere TDADataList *pDataListx = pDataMap->find(plotx); TDADataList *pDataListy = pDataMap->find(ploty); quint32 ct = pDataListy->size(); quint32 curpos=0; qreal tmpx, tmpy; QList<QPointF> fnshlst; while (curpos < ct){ ptry = (*pDataListy)[unsigned(curpos)]; ptrx = (*pDataListx)[unsigned(curpos)]; tmpx = ptrx.GetTimeSec(); tmpy = ptry.GetRealValue(); fnshlst.append(QPointF(tmpx,tmpy); curpos++; } thisSrs->appendData(fnshlst); if (!m_brthPosns.isEmpty()) // sets colors for the given QLineSeries setBrthColors(srsct); }Here is outline of the class method to set colors:
void Realtimeplot0::MultiLineSeries::setBrthColors(short srsct){
    QHash<QXYSeries::PointConfiguration, QVariant> conf;
    conf[QXYSeries::PointConfiguration::Color] = QColor(Qt::darkYellow);
    conf[QXYSeries::PointConfiguration::Size] = 1;
    conf[QXYSeries::PointConfiguration::LabelVisibility] = false;

    MultiLineSeries *thisSrs = GetLineSeries(srsct);
    // we iterate into the class object
    m_brthPosns:QList<BrthPosnPlots>::iterator brthItr = m_brthPosns.begin();
    // grab the data from the series:
    QList<QPointF> srspts = thisSrs->points();
    quint32 ctSrs = srspts.size();
    unsigned bpos;
    for (brthItr = m_brthPosns.begin(); brthItr != m_brthPosns.end(); brthItr++) {
        for (bpos = (*brthItr).GetEIPos(); bpos < (*brthItr).GetEEPos(); bpos++) {
            thisSrs->setPointConfiguration(bpos, conf);
    }

}
My question is: is there a way to collect the conf objects into a QList or something like to submit to the QLineSeries-derived class?
Or any other suggestions to speed this up. The appendData method takes 20 msec, but the setBrthColors takes nearly 2 sec for a set of about 3K data points.
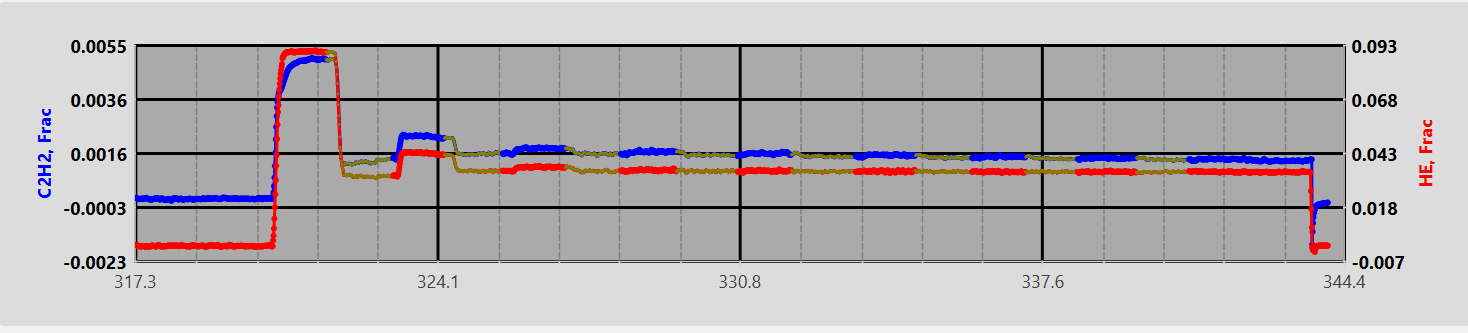
Here is screen shot of one of the three QCharts that gets colored:
Hi, you can always reduce the number of data points shown at a time, and go into more details when your chart is zoomed-in.
From the screenshot you can see that there are many "groups" where a large amount of data points are clustered and where you won't be able to spot any single data point with the naked eye. -
You are right, the underlying data comes in a 100 Hz, so trying to show 30+ sec (3K points) does seem overkill. I will look into your solution, but right now it seems that would be a lot of coding to update the data points on the QChart to match a zoom level!
Given the rather large difference in speed it takes to update the raw data (updated from a QList) vs the configuration points (updated pt-by-point), it would be nice if there were a way to update point configuration in chunks in a somewhat similar manner. When I changed the code to add raw data to the chart pt-by-pt, the speed was actually close to the speed the point configuration routine takes (1000-fold difference in speed!). -
You are right, the underlying data comes in a 100 Hz, so trying to show 30+ sec (3K points) does seem overkill. I will look into your solution, but right now it seems that would be a lot of coding to update the data points on the QChart to match a zoom level!
Given the rather large difference in speed it takes to update the raw data (updated from a QList) vs the configuration points (updated pt-by-point), it would be nice if there were a way to update point configuration in chunks in a somewhat similar manner. When I changed the code to add raw data to the chart pt-by-pt, the speed was actually close to the speed the point configuration routine takes (1000-fold difference in speed!).@nekkceb
You might want to read what Googling forqt PointConfiguration slowhas to say.If using QXYSeries, avoid individual updates in a tight loop. Instead, prepare the configuration data (e.g., QList<QPointConfiguration>) and apply it in a single batch update if possible, or use signalsBlocked(true) while updating to prevent redundant repaints
If the application is still slow, consider using QChart's signalsBlocked(true) trick to only update the visual representation periodically rather than on every single data point change
https://stackoverflow.com/a/63258832/489865
Worth a try?
Meanwhile, be aware that Qt Charts has been assassinated, to be replaced by Qt Graphs. Whether that has the same features or exhibits the same behaviour I do not know, but there certainly will be no more changes in Qt Charts and you will have to move off it at some point....
-
Thanks, solution found, similar to what you are suggesting.
I dug a bit further into Qt docs and found the entry for setPointsConfiguration, which takes data in the form ofQHash<int, QHash<QXYSeries::PointConfiguration, QVariant>>So my new code for setting the colors looks like:
        QHash<int, QHash<QXYSeries::PointConfiguration, QVariant>> ptsConfig;
        QList<BrthPosnPlots>::iterator brthItr = m_brthPosns.begin();
        MultiLineSeries *thisSrs = GetLineSeries(srs);

        QList<QPointF> srspts = thisSrs->points();
        quint32 ctSrs = srspts.size();
        if ((ctSrs < 1))
            return;
        qsizetype bpos;
        for (brthItr = m_brthPosns.begin(); brthItr != m_brthPosns.end(); brthItr++) {
            if ((*brthItr).GetEEPos() > ctSrs)
                continue;
            if (((*brthItr).GetEIPos() > 1) && ((*brthItr).GetEEPos() > (*brthItr).GetEIPos() + 5)) {
                for (bpos = (*brthItr).GetEIPos(); bpos < (*brthItr).GetEEPos(); bpos++) {
                    ptsConfig.insert_or_assign(bpos, conf);
                    // thisSrs->setPointConfiguration(bpos, conf);
                }
            }
        }
        if (!ptsConfig.isEmpty()) {
            thisSrs->setPointsConfiguration(ptsConfig);
        }
The speedup is truly amazing! From over 2 sec down to < 20 msec for this method.
Thanks to all for feedback and tips. -
N nekkceb has marked this topic as solved on