Skip to content
  • Categories
  • Recent
  • Tags
  • Popular
  • Users
  • Groups
  • Search
  • Get Qt Extensions
  • Unsolved
Collapse
Brand Logo
  1. Home
  2. Qt Development
  3. General and Desktop
  4. Qwt WaterfallPlot (QwtPlotSpectrogram) disappears on window resize with specific frequency ranges

Qwt WaterfallPlot (QwtPlotSpectrogram) disappears on window resize with specific frequency ranges

Scheduled Pinned Locked Moved Solved General and Desktop
qwtqchartchartgraphicsspectogram
3 Posts 2 Posters 84 Views 1 Watching
  • Oldest to Newest
  • Newest to Oldest
  • Most Votes
Reply
  • Reply as topic
Log in to reply
This topic has been deleted. Only users with topic management privileges can see it.
  • J Offline
    J Offline
    Joe von Habsburg
    wrote last edited by Joe von Habsburg
    #1

    Hi,
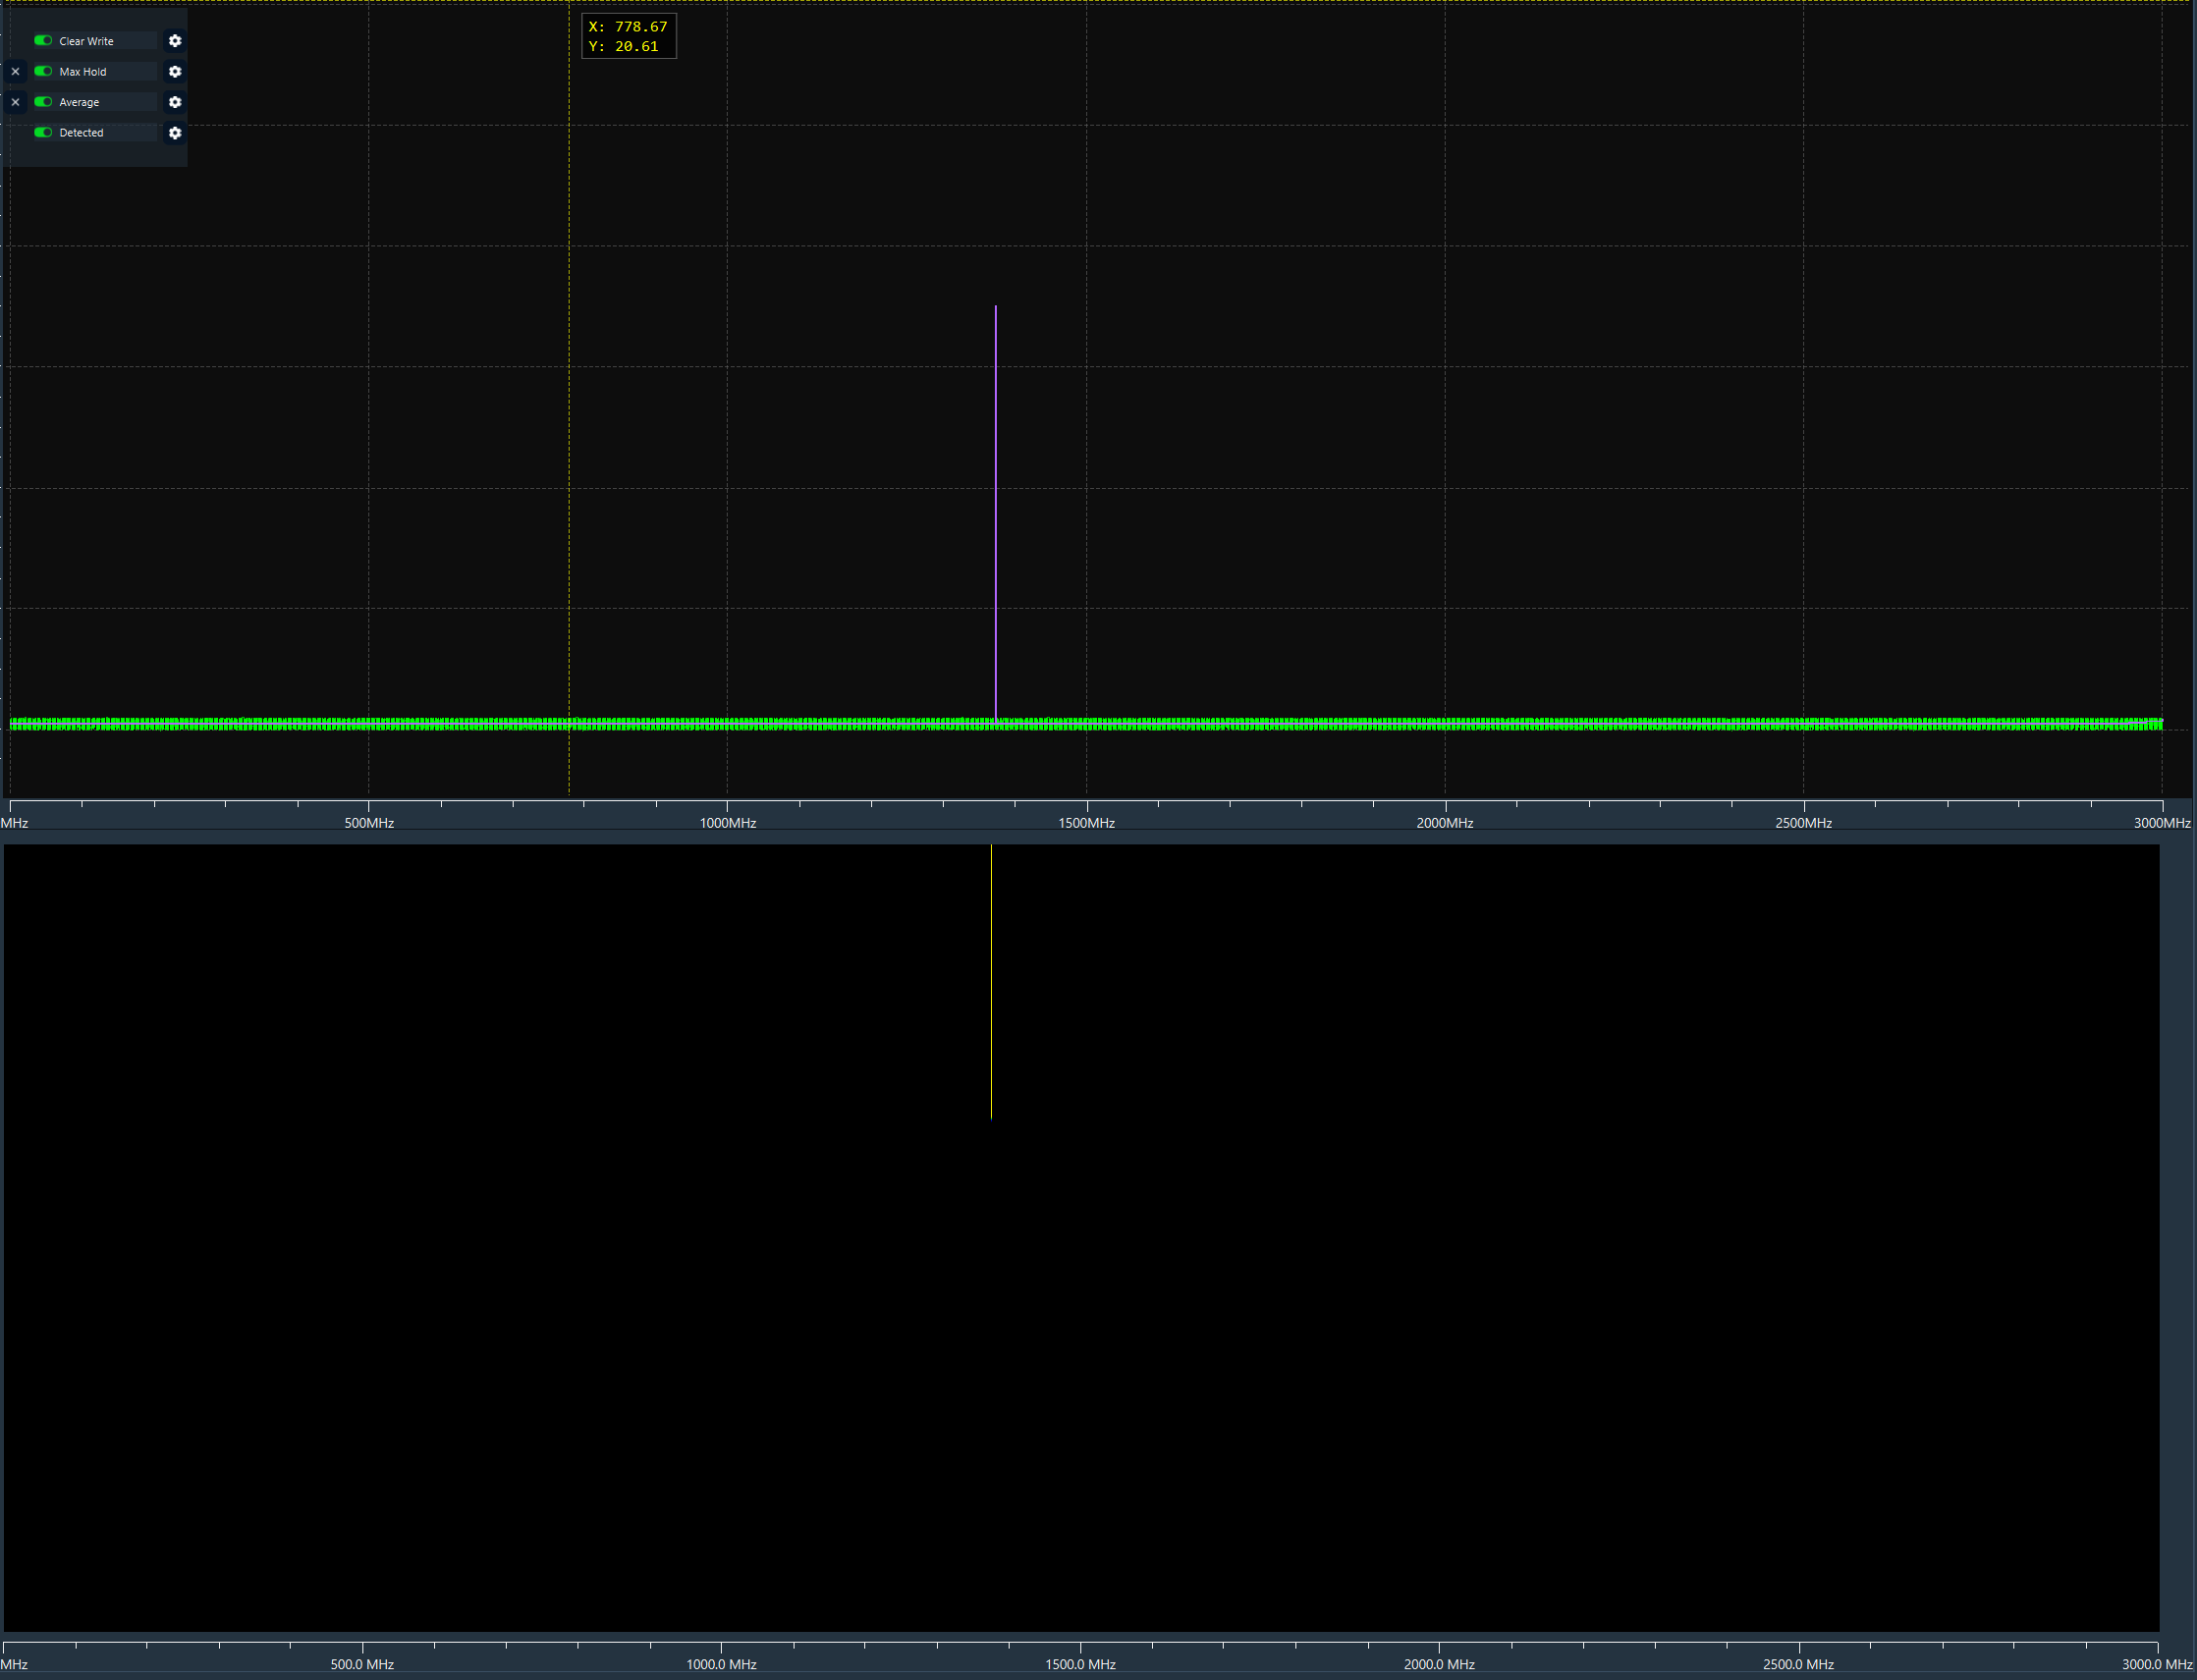
    I'm using QwtPlotSpectrogram with QwtMatrixRasterData to display a waterfall plot. I'm experiencing a strange rendering issue that only occurs with specific frequency ranges combined with window resize operations.
    Steps to reproduce:

    Display waterfall with range 0–3000 MHz → works fine in normal and maximized window
    5445c4c4-8254-4643-bef4-a7703bcb0632-image.png

    Change range to 0–2900 MHz in normal window → waterfall disappears
    61f3acc3-c224-446c-9acd-20ddffc06283-image.png

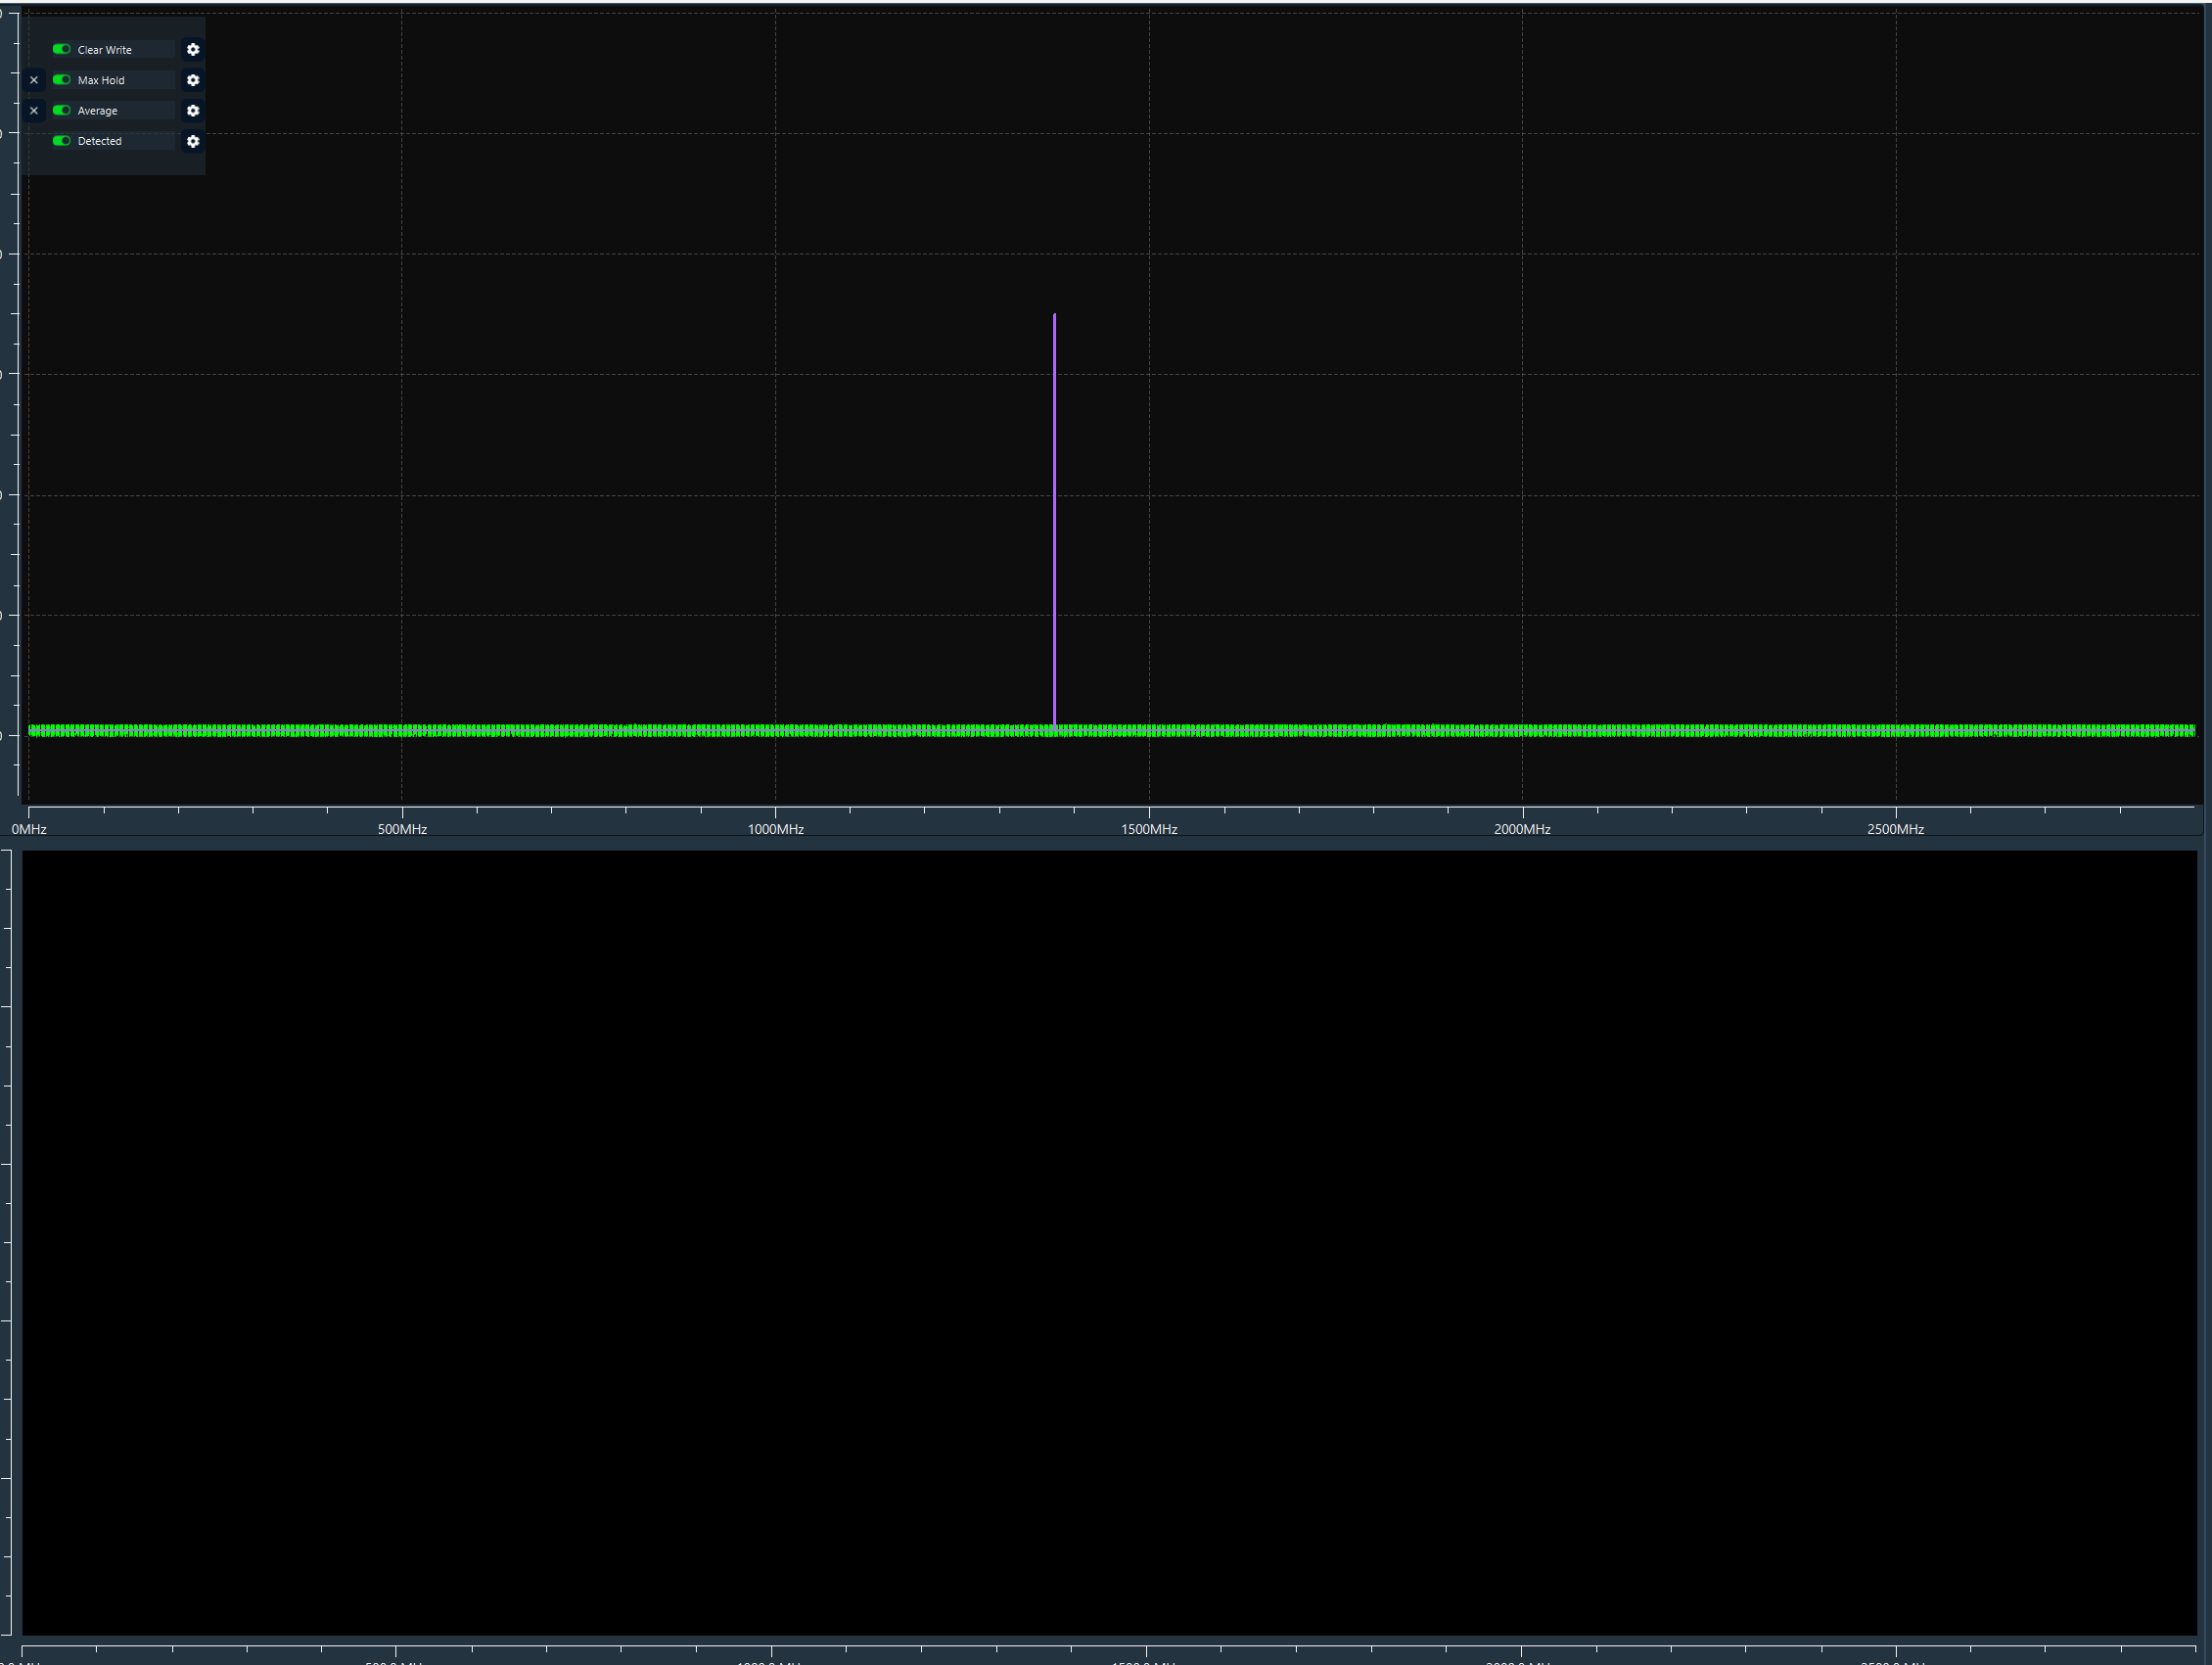
    Maximize the window → waterfall reappears
    7e6361cb-668f-4522-8ed0-38b667525536-image.png

    Restore to normal size → waterfall disappears again
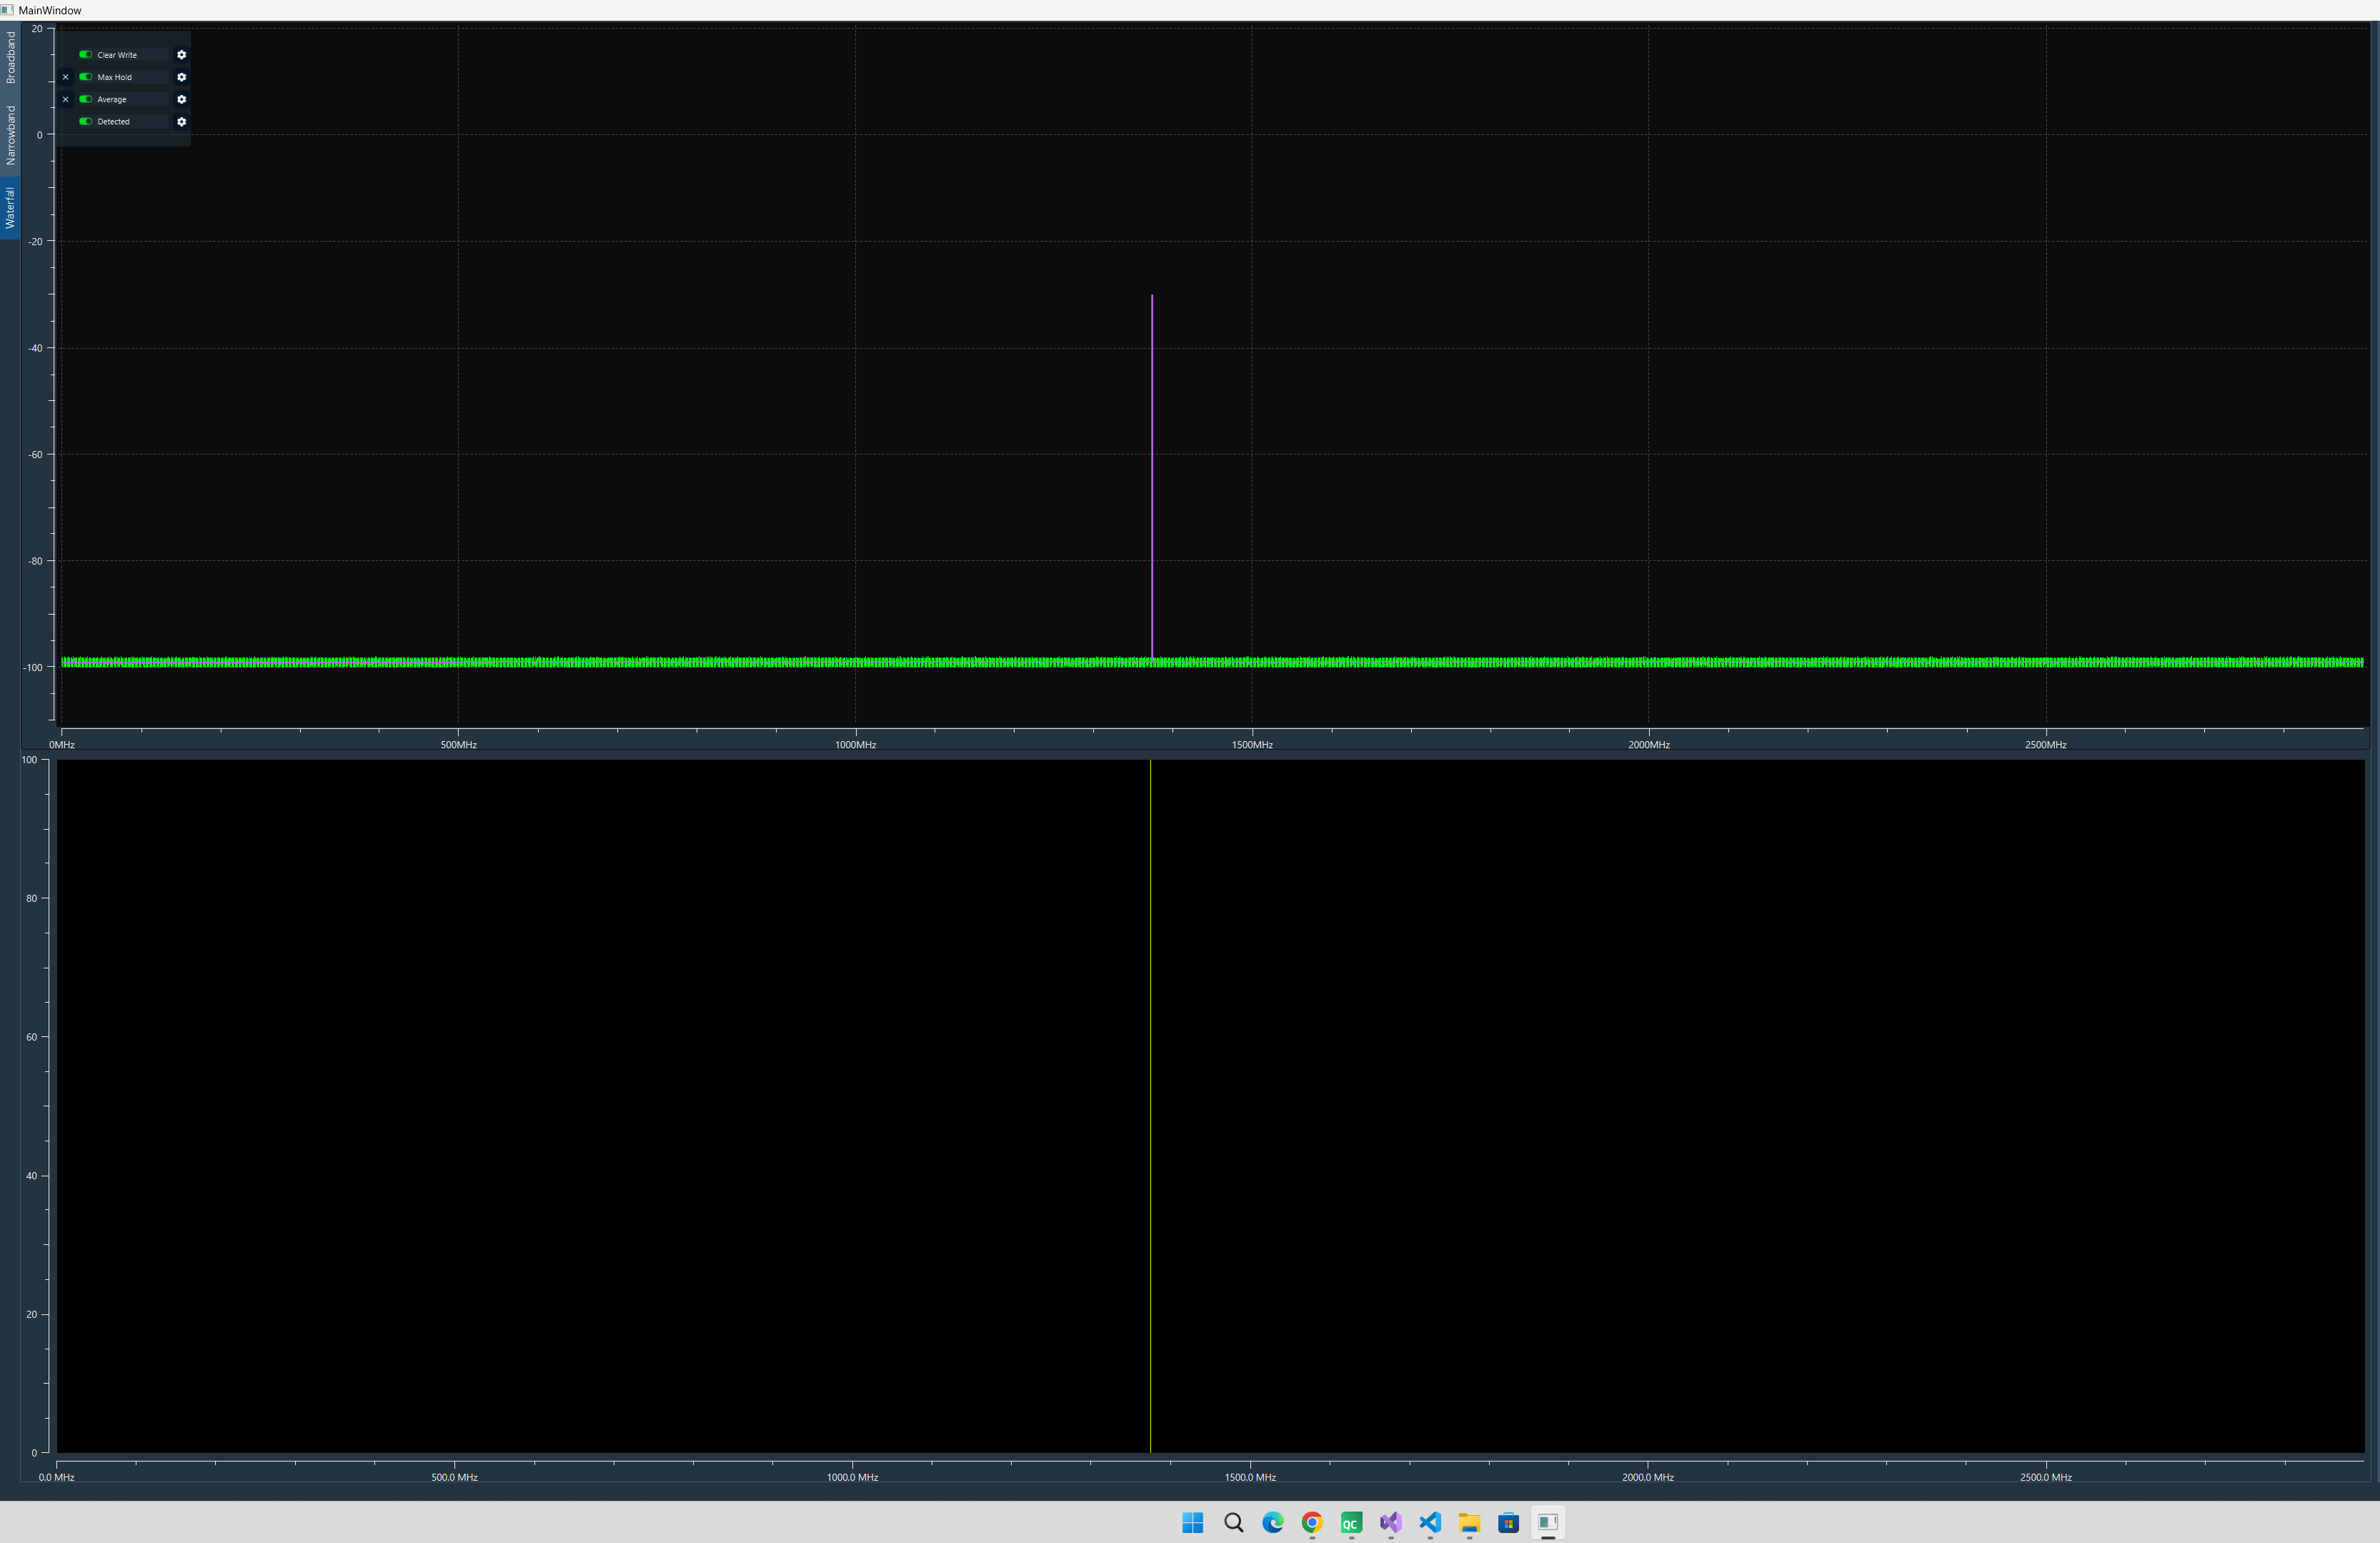
    Change range back to 0–3000 MHz → waterfall reappears in normal window and stays visible through resize
    Change range to 0–2800 MHz in normal window → works fine, waterfall visible in both normal and maximized
    Change range to 0–2900 MHz while maximized → restore to normal size → waterfall disappears

    What I've tried:

    Calling invalidateCache() + replot() on resize
    Calling raster->setValueMatrix() again on resize
    Using QTimer::singleShot to delay resize

    My setup:

    QwtPlotSpectrogram + QwtMatrixRasterData
    Matrix width changes dynamically based on frequency range
    Data is QVector<double>, updated in real-time

    1 Reply Last reply
    1
    • J Offline
      J Offline
      Joe von Habsburg
      wrote last edited by Joe von Habsburg
      #3

      I found the problem

      Problem was that I think :
      I receive 65536 point but my widget width only 2000px and 32.768(33) point equal 1px, I lost the peak value there. That is my opinion and I solved. If you are think problem is different. I listen.

      Windows 11
      Qt 6.9.x
      Qwt-6.3.0

      1 Reply Last reply
      0
      • SGaistS Offline
        SGaistS Offline
        SGaist
        Lifetime Qt Champion
        wrote last edited by SGaist
        #2

        Hi,

        Which version of Qt are you using ?
        On which platform ?
        If Linux:

        • Which distribution ?
        • Which window manager ?

        Can you please provide a minimal compilable example that shows this behaviour ?

        Interested in AI ? www.idiap.ch
        Please read the Qt Code of Conduct - https://forum.qt.io/topic/113070/qt-code-of-conduct

        1 Reply Last reply
        0
        • J Offline
          J Offline
          Joe von Habsburg
          wrote last edited by Joe von Habsburg
          #3

          I found the problem

          Problem was that I think :
          I receive 65536 point but my widget width only 2000px and 32.768(33) point equal 1px, I lost the peak value there. That is my opinion and I solved. If you are think problem is different. I listen.

          Windows 11
          Qt 6.9.x
          Qwt-6.3.0

          1 Reply Last reply
          0
          • J Joe von Habsburg has marked this topic as solved

          • Login

          • Login or register to search.
          • First post
            Last post
          0
          • Categories
          • Recent
          • Tags
          • Popular
          • Users
          • Groups
          • Search
          • Get Qt Extensions
          • Unsolved