
Qt Graphs. Building 2d plot using c++ only.
-
You can even do it without a .qml file in 6.9 by using the
QQuickWidget::setInitialPropertiesandQQuickWidget::loadFromModule:QPieSeries* pieSeries = new QPieSeries(&app); // populate it QQuickWidget* graphsView = new QQuickWidget(); graphsView->setResizeMode(QQuickWidget::SizeRootObjectToView); graphsView->setInitialProperties({{"seriesList", QVariant::fromValue(pieSeries)}}); graphsView->loadFromModule("QtGraphs", "GraphsView");@GrecKo said in Qt Graphs. Building 2d plot using c++ only.:
You can even do it without a .qml file in 6.9 by using the
QQuickWidget::setInitialPropertiesandQQuickWidget::loadFromModule:QPieSeries* pieSeries = new QPieSeries(&app); // populate it QQuickWidget* graphsView = new QQuickWidget(); graphsView->setResizeMode(QQuickWidget::SizeRootObjectToView); graphsView->setInitialProperties({{"seriesList", QVariant::fromValue(pieSeries)}}); graphsView->loadFromModule("QtGraphs", "GraphsView");Amazing! How to create a line serial that using DATETIME as X and double as Y in C++ follow this example ?
For example, a 3-days weather forcast line graph , 2 hours / point ?
Thank you!
-
 J JonB referenced this topic on
-
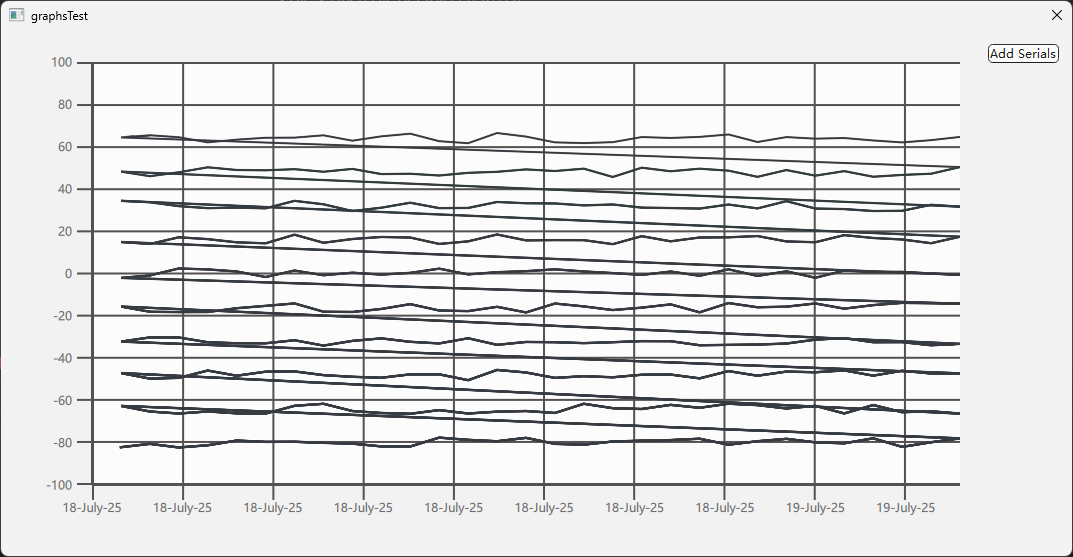
In response to the above requirements, I have written a small testing program. 10 curves can be refreshed correctly, but colors cannot be set independently, and there are extra connecting lines between the curves. Can someone help me identify where I went wrong? thank!
pro file
QT       += core gui widgets quickwidgets graphs quick

CONFIG += c++17

SOURCES += \
    main.cpp \
    graphstest.cpp

HEADERS += \
    graphstest.h

FORMS += \
    graphstest.ui
graphstest.h
#ifndef GRAPHSTEST_H
#define GRAPHSTEST_H
#include <QDateTimeAxis>
#include <QDialog>
#include <QLineSeries>
#include <QValueAxis>
#include <QVector>
QT_BEGIN_NAMESPACE
namespace Ui
{
class graphsTest;
}
QT_END_NAMESPACE

class graphsTest : public QDialog
{
	Q_OBJECT
public:
	graphsTest(QWidget *parent = nullptr);
	~graphsTest();
protected:
	void timerEvent(QTimerEvent *evt) override;
private slots:
	void on_pushButton_ok_clicked();
private:
	Ui::graphsTest *ui;
	QDateTimeAxis *m_ax;
	QValueAxis *m_ay;
	int m_timerEvent;
	QVector<QLineSeries *> m_lineSeries;
};
#endif // GRAPHSTEST_H
graphstest.cpp
#include "graphstest.h"
#include <QDateTime>
#include <QDebug>
#include <QQuickItem>
#include "ui_graphstest.h"
graphsTest::graphsTest(QWidget *parent)
	: QDialog(parent)
	, ui(new Ui::graphsTest)
	, m_ax(new QDateTimeAxis(this))
	, m_ay(new QValueAxis(this))
	, m_timerEvent(0)
{
	ui->setupUi(this);
	QDateTime dtmNow = QDateTime::currentDateTime();
	m_ax->setMin(dtmNow.addDays(-1));
	m_ax->setMax(dtmNow);
	m_ay->setRange(-100, 100);

	QList<QObject *> seriesList;
	ui->graphsView->setResizeMode(QQuickWidget::SizeRootObjectToView);
	ui->graphsView->setInitialProperties({{"seriesList", QVariant::fromValue(seriesList)},
										  {"axisX", QVariant::fromValue(m_ax)},
										  {"axisY", QVariant::fromValue(m_ay)}});
	ui->graphsView->loadFromModule("QtGraphs", "GraphsView");
	m_timerEvent = startTimer(500);
}

graphsTest::~graphsTest()
{
	delete ui;
}

void graphsTest::timerEvent(QTimerEvent *evt)
{
	if (evt->timerId() == m_timerEvent)
	{
		QList<QPointF> data;
		QDateTime dtmNow = QDateTime::currentDateTime();
		const int N = m_lineSeries.size();
		for (int n = 0; n < N; ++n)
		{
			for (int i = 0; i < 30; ++i)
			{
				data << QPointF(dtmNow.addSecs(-3600 * 24.0 / 30 * (29 - i)).toMSecsSinceEpoch(),
								(rand() % 500 - 250) / 100.0 + n * 16 - 80);
			}
			m_lineSeries[n]->replace(data);
		}
		m_ax->setMin(dtmNow.addDays(-1));
		m_ax->setMax(dtmNow);
	}
}

void graphsTest::on_pushButton_ok_clicked()
{
	if (m_lineSeries.size() >= 10)
		return;
	//Prepare new data
	QLineSeries *newLine = new QLineSeries(this);
	newLine->setColor(QColor(rand() % 128, rand() % 128, rand() % 128));
	//Add to Graph
	QVariant seriesListVariant = ui->graphsView->rootObject()->property("seriesList");
	if (seriesListVariant.canConvert<QQmlListProperty<QObject>>())
	{
		QQmlListProperty<QObject> prop = seriesListVariant.value<QQmlListProperty<QObject>>();
		prop.append(&prop, newLine);
		m_lineSeries.append(newLine);
	}
}
graphstest.ui
<?xml version="1.0" encoding="UTF-8"?>
<ui version="4.0">
 <class>graphsTest</class>
 <widget class="QDialog" name="graphsTest">
  <property name="geometry">
   <rect>
    <x>0</x>
    <y>0</y>
    <width>579</width>
    <height>332</height>
   </rect>
  </property>
  <property name="windowTitle">
   <string>graphsTest</string>
  </property>
  <layout class="QHBoxLayout" name="horizontalLayout">
   <item>
    <widget class="QQuickWidget" name="graphsView">
     <property name="resizeMode">
      <enum>QQuickWidget::ResizeMode::SizeRootObjectToView</enum>
     </property>
    </widget>
   </item>
   <item>
    <layout class="QVBoxLayout" name="verticalLayout">
     <property name="sizeConstraint">
      <enum>QLayout::SizeConstraint::SetMaximumSize</enum>
     </property>
     <item>
      <widget class="QPushButton" name="pushButton_ok">
       <property name="sizePolicy">
        <sizepolicy hsizetype="Fixed" vsizetype="Fixed">
         <horstretch>0</horstretch>
         <verstretch>0</verstretch>
        </sizepolicy>
       </property>
       <property name="text">
        <string>Add Serials</string>
       </property>
      </widget>
     </item>
     <item>
      <spacer name="verticalSpacer">
       <property name="sizePolicy">
        <sizepolicy hsizetype="Fixed" vsizetype="Expanding">
         <horstretch>0</horstretch>
         <verstretch>0</verstretch>
        </sizepolicy>
       </property>
       <property name="orientation">
        <enum>Qt::Orientation::Vertical</enum>
       </property>
       <property name="sizeHint" stdset="0">
        <size>
         <width>20</width>
         <height>40</height>
        </size>
       </property>
      </spacer>
     </item>
    </layout>
   </item>
  </layout>
 </widget>
 <customwidgets>
  <customwidget>
   <class>QQuickWidget</class>
   <extends>QWidget</extends>
   <header location="global">QtQuickWidgets/QQuickWidget</header>
  </customwidget>
 </customwidgets>
 <resources/>
 <connections/>
</ui>
main.cpp
#include "graphstest.h"
#include <QApplication>
int main(int argc, char *argv[])
{
	QApplication a(argc, argv);
	graphsTest w;
	w.show();
	return a.exec();
}
Qt 6.9.1 Mingw64 in windows 11:
Further more, how to add a rubber-band selection tool and connect QML signals to the C++ slots, is a bit hard for me . I'll try it later.
Qt is the best C++ framework I've ever met.
-
B BugSleeper referenced this topic on
-
In response to the above requirements, I have written a small testing program. 10 curves can be refreshed correctly, but colors cannot be set independently, and there are extra connecting lines between the curves. Can someone help me identify where I went wrong? thank!
pro file
QT       += core gui widgets quickwidgets graphs quick

CONFIG += c++17

SOURCES += \
    main.cpp \
    graphstest.cpp

HEADERS += \
    graphstest.h

FORMS += \
    graphstest.ui
graphstest.h
#ifndef GRAPHSTEST_H
#define GRAPHSTEST_H
#include <QDateTimeAxis>
#include <QDialog>
#include <QLineSeries>
#include <QValueAxis>
#include <QVector>
QT_BEGIN_NAMESPACE
namespace Ui
{
class graphsTest;
}
QT_END_NAMESPACE

class graphsTest : public QDialog
{
	Q_OBJECT
public:
	graphsTest(QWidget *parent = nullptr);
	~graphsTest();
protected:
	void timerEvent(QTimerEvent *evt) override;
private slots:
	void on_pushButton_ok_clicked();
private:
	Ui::graphsTest *ui;
	QDateTimeAxis *m_ax;
	QValueAxis *m_ay;
	int m_timerEvent;
	QVector<QLineSeries *> m_lineSeries;
};
#endif // GRAPHSTEST_H
graphstest.cpp
#include "graphstest.h"
#include <QDateTime>
#include <QDebug>
#include <QQuickItem>
#include "ui_graphstest.h"
graphsTest::graphsTest(QWidget *parent)
	: QDialog(parent)
	, ui(new Ui::graphsTest)
	, m_ax(new QDateTimeAxis(this))
	, m_ay(new QValueAxis(this))
	, m_timerEvent(0)
{
	ui->setupUi(this);
	QDateTime dtmNow = QDateTime::currentDateTime();
	m_ax->setMin(dtmNow.addDays(-1));
	m_ax->setMax(dtmNow);
	m_ay->setRange(-100, 100);

	QList<QObject *> seriesList;
	ui->graphsView->setResizeMode(QQuickWidget::SizeRootObjectToView);
	ui->graphsView->setInitialProperties({{"seriesList", QVariant::fromValue(seriesList)},
										  {"axisX", QVariant::fromValue(m_ax)},
										  {"axisY", QVariant::fromValue(m_ay)}});
	ui->graphsView->loadFromModule("QtGraphs", "GraphsView");
	m_timerEvent = startTimer(500);
}

graphsTest::~graphsTest()
{
	delete ui;
}

void graphsTest::timerEvent(QTimerEvent *evt)
{
	if (evt->timerId() == m_timerEvent)
	{
		QList<QPointF> data;
		QDateTime dtmNow = QDateTime::currentDateTime();
		const int N = m_lineSeries.size();
		for (int n = 0; n < N; ++n)
		{
			for (int i = 0; i < 30; ++i)
			{
				data << QPointF(dtmNow.addSecs(-3600 * 24.0 / 30 * (29 - i)).toMSecsSinceEpoch(),
								(rand() % 500 - 250) / 100.0 + n * 16 - 80);
			}
			m_lineSeries[n]->replace(data);
		}
		m_ax->setMin(dtmNow.addDays(-1));
		m_ax->setMax(dtmNow);
	}
}

void graphsTest::on_pushButton_ok_clicked()
{
	if (m_lineSeries.size() >= 10)
		return;
	//Prepare new data
	QLineSeries *newLine = new QLineSeries(this);
	newLine->setColor(QColor(rand() % 128, rand() % 128, rand() % 128));
	//Add to Graph
	QVariant seriesListVariant = ui->graphsView->rootObject()->property("seriesList");
	if (seriesListVariant.canConvert<QQmlListProperty<QObject>>())
	{
		QQmlListProperty<QObject> prop = seriesListVariant.value<QQmlListProperty<QObject>>();
		prop.append(&prop, newLine);
		m_lineSeries.append(newLine);
	}
}
graphstest.ui
<?xml version="1.0" encoding="UTF-8"?>
<ui version="4.0">
 <class>graphsTest</class>
 <widget class="QDialog" name="graphsTest">
  <property name="geometry">
   <rect>
    <x>0</x>
    <y>0</y>
    <width>579</width>
    <height>332</height>
   </rect>
  </property>
  <property name="windowTitle">
   <string>graphsTest</string>
  </property>
  <layout class="QHBoxLayout" name="horizontalLayout">
   <item>
    <widget class="QQuickWidget" name="graphsView">
     <property name="resizeMode">
      <enum>QQuickWidget::ResizeMode::SizeRootObjectToView</enum>
     </property>
    </widget>
   </item>
   <item>
    <layout class="QVBoxLayout" name="verticalLayout">
     <property name="sizeConstraint">
      <enum>QLayout::SizeConstraint::SetMaximumSize</enum>
     </property>
     <item>
      <widget class="QPushButton" name="pushButton_ok">
       <property name="sizePolicy">
        <sizepolicy hsizetype="Fixed" vsizetype="Fixed">
         <horstretch>0</horstretch>
         <verstretch>0</verstretch>
        </sizepolicy>
       </property>
       <property name="text">
        <string>Add Serials</string>
       </property>
      </widget>
     </item>
     <item>
      <spacer name="verticalSpacer">
       <property name="sizePolicy">
        <sizepolicy hsizetype="Fixed" vsizetype="Expanding">
         <horstretch>0</horstretch>
         <verstretch>0</verstretch>
        </sizepolicy>
       </property>
       <property name="orientation">
        <enum>Qt::Orientation::Vertical</enum>
       </property>
       <property name="sizeHint" stdset="0">
        <size>
         <width>20</width>
         <height>40</height>
        </size>
       </property>
      </spacer>
     </item>
    </layout>
   </item>
  </layout>
 </widget>
 <customwidgets>
  <customwidget>
   <class>QQuickWidget</class>
   <extends>QWidget</extends>
   <header location="global">QtQuickWidgets/QQuickWidget</header>
  </customwidget>
 </customwidgets>
 <resources/>
 <connections/>
</ui>
main.cpp
#include "graphstest.h"
#include <QApplication>
int main(int argc, char *argv[])
{
	QApplication a(argc, argv);
	graphsTest w;
	w.show();
	return a.exec();
}
Qt 6.9.1 Mingw64 in windows 11:
Further more, how to add a rubber-band selection tool and connect QML signals to the C++ slots, is a bit hard for me . I'll try it later.
@goldenhawking You failed to clear QList<QPointF> data; at each time a new line is perpared!
if (evt->timerId() == m_timerEvent) { QDateTime dtmNow = QDateTime::currentDateTime(); const int N = m_lineSeries.size(); for (int n = 0; n < N; ++n) { QList<QPointF> data; //Here for (int i = 0; i < 30; ++i) { data << QPointF(dtmNow.addSecs(-3600 * 24.0 / 30 * (29 - i)).toMSecsSinceEpoch(), (rand() % 500 - 250) / 100.0 + n * 16 - 80); } m_lineSeries[n]->replace(data); } //... -
@goldenhawking You failed to clear QList<QPointF> data; at each time a new line is perpared!
if (evt->timerId() == m_timerEvent) { QDateTime dtmNow = QDateTime::currentDateTime(); const int N = m_lineSeries.size(); for (int n = 0; n < N; ++n) { QList<QPointF> data; //Here for (int i = 0; i < 30; ++i) { data << QPointF(dtmNow.addSecs(-3600 * 24.0 / 30 * (29 - i)).toMSecsSinceEpoch(), (rand() % 500 - 250) / 100.0 + n * 16 - 80); } m_lineSeries[n]->replace(data); } //...@BugSleeper said in Qt Graphs. Building 2d plot using c++ only.:
So you're talking to yourself now? Why two accounts?
Qt Online Installer direct download: https://download.qt.io/official_releases/online_installers/
Visit the Qt Academy at https://academy.qt.io/catalog -
@BugSleeper said in Qt Graphs. Building 2d plot using c++ only.:
So you're talking to yourself now? Why two accounts?
@Christian-Ehrlicher said in Qt Graphs. Building 2d plot using c++ only.:
ing to yourself now? Why two accounts?
I'm GH's student, We're using a same computer!
-
@Christian-Ehrlicher said in Qt Graphs. Building 2d plot using c++ only.:
ing to yourself now? Why two accounts?
I'm GH's student, We're using a same computer!
@BugSleeper said in Qt Graphs. Building 2d plot using c++ only.:
I'm GH's student, We're using a same computer!
This explains it. Thx.
We have a lot of really interesting spam in the last weeks so this was somewhat suspicious.Qt Online Installer direct download: https://download.qt.io/official_releases/online_installers/
Visit the Qt Academy at https://academy.qt.io/catalog -
@BugSleeper said in Qt Graphs. Building 2d plot using c++ only.:
I'm GH's student, We're using a same computer!
This explains it. Thx.
We have a lot of really interesting spam in the last weeks so this was somewhat suspicious.@everyone
Another question is , how to remove one line from current list in C++? Some App such as process monitor will frequently add or remove lines in the middle of current list. However, I notice that QML List operations can only add or remove objects from the end.
//qqmllist.h
    AppendFunction append = nullptr;
    CountFunction count = nullptr;
    AtFunction at = nullptr;
    ClearFunction clear = nullptr;
    ReplaceFunction replace = nullptr;
    RemoveLastFunction removeLast = nullptr;
At this moment, we can clear the graph, and re-add lines. But this is not a nice solution. May be a "removeAt" function or "removeOne" can be adopted for this usage in future.
There seems to be extra works for QScatterSeries and other classes from QtCharts to QtGraphs, new class has fewer functions and properties than old one. And, Will multi-Y Axises be supported in future ? For example, we can bind a line series to left axis in Kg or right axis in Meters.