
Qt Graphs. Building 2d plot using c++ only.
-
Where I was rude?!
BTW: Exactly that bit you quoted from the documentation, I've linked and quoted above already ;-)
It is the way it is... the new QtGraphs module uses a QML backend for rendering, even when you use its C++ / QtWidget API@Pl45m4 said in Qt Graphs. Building 2d plot using c++ only.:
Where I was rude?!
You were not rude anywhere, only helpful/to the point. Maybe @SandSnip3r misread or misunderstood.
-
Maybe I misunderstood.
Sorry, I'm still having trouble understanding how to use a 2d "QtGraph" from C++. You said "the new QtGraphs module uses a QML backend for rendering, even when you use its C++ / QtWidget API." That's fine, but how do you construct & interact with a 2d "Qt Graph" (which uses a "QML backend")?
I see that there are C++ classes for Qt Graphs, like https://doc.qt.io/qt-6/qlineseries.html, but this seems to just be a class which represents data? What's the C++ class which I use as the view? Is there some QWidget-based class which I'd then add the series to?
@SandSnip3r said in Qt Graphs. Building 2d plot using c++ only.:
What's the C++ class which I use as the view? Is there some QWidget-based class which I'd then add the series to?
The QtGraphs Module is still under development.
I think the correct class isQGraphsView, but it doesn't seem to exist yet.It's mentioned here as this function returns this type.
-
Isn't the Graphs moved out of technical preview as of 6.8? I thought I saw something, but cant find it again, about the qt widgets support for 2d graphs being lagging. Do you know if Qt communicates this roadmap externally? I don't see anything about it the Jira board of known issues.
-
Does Graphs even aim to replace the current 2d qt charts? Or is Graphs just meant to be a 3d thing?
If it does, is there a way to use the qml-based Qt Graphs from C++?
-
Isn't the Graphs moved out of technical preview as of 6.8? I thought I saw something, but cant find it again, about the qt widgets support for 2d graphs being lagging. Do you know if Qt communicates this roadmap externally? I don't see anything about it the Jira board of known issues.
@SandSnip3r said in Qt Graphs. Building 2d plot using c++ only.:
Isn't the Graphs moved out of technical preview as of 6.8?
Should be but as you can see from OPs question
QGraphsView, the C++ API to access the QML backend is mentioned in the documentation but not implemented nor it has it's own documentation page... the links lead to nowhere... :(Maybe use the QML interface for now and handle it like any other hybrid QML/C++ app
QGraphsshould be 2D and 3D + C++ and QML... but not everything seem to work right now. -
QML uses the local 3D engine of the operating system to render the Plot, rather than the traditional GraphicsView technology used under QtWidgets. This change may be more modern and beneficial for the Qt team to focus on optimizing one framework and reducing costs. The main.qml in the new example is also easy to understand.
The first problem is that the frame rate of QML is low for cheap laptops without independent graphics cards. One important reason for using Qt in the beginning was an example called "10000 chips" (I'm not sure if the number of zeros is correct) , which surprisingly runs very smoothly on old Ubuntu netbooks , with basic Intel core graphics . The rendering effect of QtWidgets achieves the best balance between platform universality, usability, and aesthetics. The new QML is clearly more suitable for mobile devices and morden PCs.
In addition, it is also a common function to directly obtain mouse click messages from internal Chart objects to the outside C++ application , such as calculating new interpolation parameters based on user clicks. Before QtCharts, these were generally implemented using classical Qwt. I think the dense signal slot interaction between QML and C++is another big challenge.
-
Hello!! I found GraphsView QML Type, but I did not find it c++ class. I found it in the closed part of the library - qgraphsview_p.h
Why? How to build a 2d plot using C++ classes? QValueAxis and other classes are presented in C++, but not QGraphsView@Vernat said in Qt Graphs. Building 2d plot using c++ only.:
QValueAxis and other classes are presented in C++, but not QGraphsView
Currently, we can subclass QValueAxis in C++ to add our own functionality, and expose our custom subclass to QML (via
QML_ELEMENT).From what I can see, QGraphsView inherits QQuickItem, so I doubt it's intended to be used in pure C++ (at least not until we have a full-fledged C++ API for Qt Quick). But I've asked Qt R&D for official clarification on QGraphsView: https://bugreports.qt.io/browse/QTBUG-138456
How to build a 2d plot using C++ classes?
From what I can see, there is no public C++ API for 2D graphs at this time. I don't know if it's on the roadmap or not, but there is a C++ API for 3D graphs: https://doc.qt.io/qt-6/graphs-3d-widgets.html
-
It looks like the GraphsView API will be QML-only. Integration with C++ is done via QQuickWidget: https://doc.qt.io/qt-6/qtgraphs-2d-quickwidgetgraphs-example.html
-
You can even do it without a .qml file in 6.9 by using the
QQuickWidget::setInitialPropertiesandQQuickWidget::loadFromModule:QPieSeries* pieSeries = new QPieSeries(&app); // populate it QQuickWidget* graphsView = new QQuickWidget(); graphsView->setResizeMode(QQuickWidget::SizeRootObjectToView); graphsView->setInitialProperties({{"seriesList", QVariant::fromValue(pieSeries)}}); graphsView->loadFromModule("QtGraphs", "GraphsView"); -
You can even do it without a .qml file in 6.9 by using the
QQuickWidget::setInitialPropertiesandQQuickWidget::loadFromModule:QPieSeries* pieSeries = new QPieSeries(&app); // populate it QQuickWidget* graphsView = new QQuickWidget(); graphsView->setResizeMode(QQuickWidget::SizeRootObjectToView); graphsView->setInitialProperties({{"seriesList", QVariant::fromValue(pieSeries)}}); graphsView->loadFromModule("QtGraphs", "GraphsView");@GrecKo said in Qt Graphs. Building 2d plot using c++ only.:
You can even do it without a .qml file in 6.9 by using the
QQuickWidget::setInitialPropertiesandQQuickWidget::loadFromModule:QPieSeries* pieSeries = new QPieSeries(&app); // populate it QQuickWidget* graphsView = new QQuickWidget(); graphsView->setResizeMode(QQuickWidget::SizeRootObjectToView); graphsView->setInitialProperties({{"seriesList", QVariant::fromValue(pieSeries)}}); graphsView->loadFromModule("QtGraphs", "GraphsView");Amazing! How to create a line serial that using DATETIME as X and double as Y in C++ follow this example ?
For example, a 3-days weather forcast line graph , 2 hours / point ?
Thank you!
-
 J JonB referenced this topic on
-
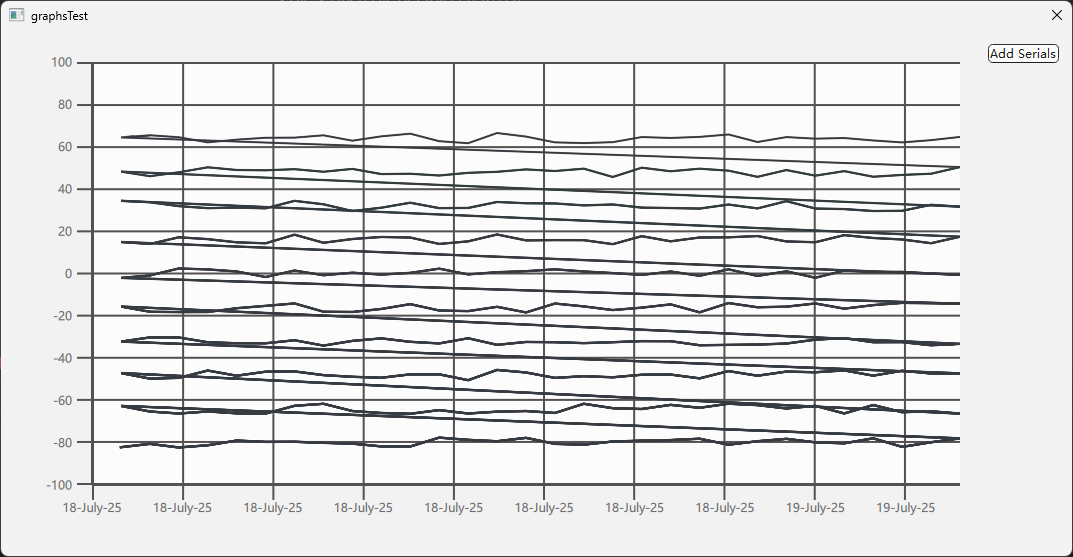
In response to the above requirements, I have written a small testing program. 10 curves can be refreshed correctly, but colors cannot be set independently, and there are extra connecting lines between the curves. Can someone help me identify where I went wrong? thank!
pro file
QT       += core gui widgets quickwidgets graphs quick

CONFIG += c++17

SOURCES += \
    main.cpp \
    graphstest.cpp

HEADERS += \
    graphstest.h

FORMS += \
    graphstest.ui
graphstest.h
#ifndef GRAPHSTEST_H
#define GRAPHSTEST_H
#include <QDateTimeAxis>
#include <QDialog>
#include <QLineSeries>
#include <QValueAxis>
#include <QVector>
QT_BEGIN_NAMESPACE
namespace Ui
{
class graphsTest;
}
QT_END_NAMESPACE

class graphsTest : public QDialog
{
	Q_OBJECT
public:
	graphsTest(QWidget *parent = nullptr);
	~graphsTest();
protected:
	void timerEvent(QTimerEvent *evt) override;
private slots:
	void on_pushButton_ok_clicked();
private:
	Ui::graphsTest *ui;
	QDateTimeAxis *m_ax;
	QValueAxis *m_ay;
	int m_timerEvent;
	QVector<QLineSeries *> m_lineSeries;
};
#endif // GRAPHSTEST_H
graphstest.cpp
#include "graphstest.h"
#include <QDateTime>
#include <QDebug>
#include <QQuickItem>
#include "ui_graphstest.h"
graphsTest::graphsTest(QWidget *parent)
	: QDialog(parent)
	, ui(new Ui::graphsTest)
	, m_ax(new QDateTimeAxis(this))
	, m_ay(new QValueAxis(this))
	, m_timerEvent(0)
{
	ui->setupUi(this);
	QDateTime dtmNow = QDateTime::currentDateTime();
	m_ax->setMin(dtmNow.addDays(-1));
	m_ax->setMax(dtmNow);
	m_ay->setRange(-100, 100);

	QList<QObject *> seriesList;
	ui->graphsView->setResizeMode(QQuickWidget::SizeRootObjectToView);
	ui->graphsView->setInitialProperties({{"seriesList", QVariant::fromValue(seriesList)},
										  {"axisX", QVariant::fromValue(m_ax)},
										  {"axisY", QVariant::fromValue(m_ay)}});
	ui->graphsView->loadFromModule("QtGraphs", "GraphsView");
	m_timerEvent = startTimer(500);
}

graphsTest::~graphsTest()
{
	delete ui;
}

void graphsTest::timerEvent(QTimerEvent *evt)
{
	if (evt->timerId() == m_timerEvent)
	{
		QList<QPointF> data;
		QDateTime dtmNow = QDateTime::currentDateTime();
		const int N = m_lineSeries.size();
		for (int n = 0; n < N; ++n)
		{
			for (int i = 0; i < 30; ++i)
			{
				data << QPointF(dtmNow.addSecs(-3600 * 24.0 / 30 * (29 - i)).toMSecsSinceEpoch(),
								(rand() % 500 - 250) / 100.0 + n * 16 - 80);
			}
			m_lineSeries[n]->replace(data);
		}
		m_ax->setMin(dtmNow.addDays(-1));
		m_ax->setMax(dtmNow);
	}
}

void graphsTest::on_pushButton_ok_clicked()
{
	if (m_lineSeries.size() >= 10)
		return;
	//Prepare new data
	QLineSeries *newLine = new QLineSeries(this);
	newLine->setColor(QColor(rand() % 128, rand() % 128, rand() % 128));
	//Add to Graph
	QVariant seriesListVariant = ui->graphsView->rootObject()->property("seriesList");
	if (seriesListVariant.canConvert<QQmlListProperty<QObject>>())
	{
		QQmlListProperty<QObject> prop = seriesListVariant.value<QQmlListProperty<QObject>>();
		prop.append(&prop, newLine);
		m_lineSeries.append(newLine);
	}
}
graphstest.ui
<?xml version="1.0" encoding="UTF-8"?>
<ui version="4.0">
 <class>graphsTest</class>
 <widget class="QDialog" name="graphsTest">
  <property name="geometry">
   <rect>
    <x>0</x>
    <y>0</y>
    <width>579</width>
    <height>332</height>
   </rect>
  </property>
  <property name="windowTitle">
   <string>graphsTest</string>
  </property>
  <layout class="QHBoxLayout" name="horizontalLayout">
   <item>
    <widget class="QQuickWidget" name="graphsView">
     <property name="resizeMode">
      <enum>QQuickWidget::ResizeMode::SizeRootObjectToView</enum>
     </property>
    </widget>
   </item>
   <item>
    <layout class="QVBoxLayout" name="verticalLayout">
     <property name="sizeConstraint">
      <enum>QLayout::SizeConstraint::SetMaximumSize</enum>
     </property>
     <item>
      <widget class="QPushButton" name="pushButton_ok">
       <property name="sizePolicy">
        <sizepolicy hsizetype="Fixed" vsizetype="Fixed">
         <horstretch>0</horstretch>
         <verstretch>0</verstretch>
        </sizepolicy>
       </property>
       <property name="text">
        <string>Add Serials</string>
       </property>
      </widget>
     </item>
     <item>
      <spacer name="verticalSpacer">
       <property name="sizePolicy">
        <sizepolicy hsizetype="Fixed" vsizetype="Expanding">
         <horstretch>0</horstretch>
         <verstretch>0</verstretch>
        </sizepolicy>
       </property>
       <property name="orientation">
        <enum>Qt::Orientation::Vertical</enum>
       </property>
       <property name="sizeHint" stdset="0">
        <size>
         <width>20</width>
         <height>40</height>
        </size>
       </property>
      </spacer>
     </item>
    </layout>
   </item>
  </layout>
 </widget>
 <customwidgets>
  <customwidget>
   <class>QQuickWidget</class>
   <extends>QWidget</extends>
   <header location="global">QtQuickWidgets/QQuickWidget</header>
  </customwidget>
 </customwidgets>
 <resources/>
 <connections/>
</ui>
main.cpp
#include "graphstest.h"
#include <QApplication>
int main(int argc, char *argv[])
{
	QApplication a(argc, argv);
	graphsTest w;
	w.show();
	return a.exec();
}
Qt 6.9.1 Mingw64 in windows 11:
Further more, how to add a rubber-band selection tool and connect QML signals to the C++ slots, is a bit hard for me . I'll try it later.
Qt is the best C++ framework I've ever met.
-
B BugSleeper referenced this topic on
-
In response to the above requirements, I have written a small testing program. 10 curves can be refreshed correctly, but colors cannot be set independently, and there are extra connecting lines between the curves. Can someone help me identify where I went wrong? thank!
pro file
QT       += core gui widgets quickwidgets graphs quick

CONFIG += c++17

SOURCES += \
    main.cpp \
    graphstest.cpp

HEADERS += \
    graphstest.h

FORMS += \
    graphstest.ui
graphstest.h
#ifndef GRAPHSTEST_H
#define GRAPHSTEST_H
#include <QDateTimeAxis>
#include <QDialog>
#include <QLineSeries>
#include <QValueAxis>
#include <QVector>
QT_BEGIN_NAMESPACE
namespace Ui
{
class graphsTest;
}
QT_END_NAMESPACE

class graphsTest : public QDialog
{
	Q_OBJECT
public:
	graphsTest(QWidget *parent = nullptr);
	~graphsTest();
protected:
	void timerEvent(QTimerEvent *evt) override;
private slots:
	void on_pushButton_ok_clicked();
private:
	Ui::graphsTest *ui;
	QDateTimeAxis *m_ax;
	QValueAxis *m_ay;
	int m_timerEvent;
	QVector<QLineSeries *> m_lineSeries;
};
#endif // GRAPHSTEST_H
graphstest.cpp
#include "graphstest.h"
#include <QDateTime>
#include <QDebug>
#include <QQuickItem>
#include "ui_graphstest.h"
graphsTest::graphsTest(QWidget *parent)
	: QDialog(parent)
	, ui(new Ui::graphsTest)
	, m_ax(new QDateTimeAxis(this))
	, m_ay(new QValueAxis(this))
	, m_timerEvent(0)
{
	ui->setupUi(this);
	QDateTime dtmNow = QDateTime::currentDateTime();
	m_ax->setMin(dtmNow.addDays(-1));
	m_ax->setMax(dtmNow);
	m_ay->setRange(-100, 100);

	QList<QObject *> seriesList;
	ui->graphsView->setResizeMode(QQuickWidget::SizeRootObjectToView);
	ui->graphsView->setInitialProperties({{"seriesList", QVariant::fromValue(seriesList)},
										  {"axisX", QVariant::fromValue(m_ax)},
										  {"axisY", QVariant::fromValue(m_ay)}});
	ui->graphsView->loadFromModule("QtGraphs", "GraphsView");
	m_timerEvent = startTimer(500);
}

graphsTest::~graphsTest()
{
	delete ui;
}

void graphsTest::timerEvent(QTimerEvent *evt)
{
	if (evt->timerId() == m_timerEvent)
	{
		QList<QPointF> data;
		QDateTime dtmNow = QDateTime::currentDateTime();
		const int N = m_lineSeries.size();
		for (int n = 0; n < N; ++n)
		{
			for (int i = 0; i < 30; ++i)
			{
				data << QPointF(dtmNow.addSecs(-3600 * 24.0 / 30 * (29 - i)).toMSecsSinceEpoch(),
								(rand() % 500 - 250) / 100.0 + n * 16 - 80);
			}
			m_lineSeries[n]->replace(data);
		}
		m_ax->setMin(dtmNow.addDays(-1));
		m_ax->setMax(dtmNow);
	}
}

void graphsTest::on_pushButton_ok_clicked()
{
	if (m_lineSeries.size() >= 10)
		return;
	//Prepare new data
	QLineSeries *newLine = new QLineSeries(this);
	newLine->setColor(QColor(rand() % 128, rand() % 128, rand() % 128));
	//Add to Graph
	QVariant seriesListVariant = ui->graphsView->rootObject()->property("seriesList");
	if (seriesListVariant.canConvert<QQmlListProperty<QObject>>())
	{
		QQmlListProperty<QObject> prop = seriesListVariant.value<QQmlListProperty<QObject>>();
		prop.append(&prop, newLine);
		m_lineSeries.append(newLine);
	}
}
graphstest.ui
<?xml version="1.0" encoding="UTF-8"?>
<ui version="4.0">
 <class>graphsTest</class>
 <widget class="QDialog" name="graphsTest">
  <property name="geometry">
   <rect>
    <x>0</x>
    <y>0</y>
    <width>579</width>
    <height>332</height>
   </rect>
  </property>
  <property name="windowTitle">
   <string>graphsTest</string>
  </property>
  <layout class="QHBoxLayout" name="horizontalLayout">
   <item>
    <widget class="QQuickWidget" name="graphsView">
     <property name="resizeMode">
      <enum>QQuickWidget::ResizeMode::SizeRootObjectToView</enum>
     </property>
    </widget>
   </item>
   <item>
    <layout class="QVBoxLayout" name="verticalLayout">
     <property name="sizeConstraint">
      <enum>QLayout::SizeConstraint::SetMaximumSize</enum>
     </property>
     <item>
      <widget class="QPushButton" name="pushButton_ok">
       <property name="sizePolicy">
        <sizepolicy hsizetype="Fixed" vsizetype="Fixed">
         <horstretch>0</horstretch>
         <verstretch>0</verstretch>
        </sizepolicy>
       </property>
       <property name="text">
        <string>Add Serials</string>
       </property>
      </widget>
     </item>
     <item>
      <spacer name="verticalSpacer">
       <property name="sizePolicy">
        <sizepolicy hsizetype="Fixed" vsizetype="Expanding">
         <horstretch>0</horstretch>
         <verstretch>0</verstretch>
        </sizepolicy>
       </property>
       <property name="orientation">
        <enum>Qt::Orientation::Vertical</enum>
       </property>
       <property name="sizeHint" stdset="0">
        <size>
         <width>20</width>
         <height>40</height>
        </size>
       </property>
      </spacer>
     </item>
    </layout>
   </item>
  </layout>
 </widget>
 <customwidgets>
  <customwidget>
   <class>QQuickWidget</class>
   <extends>QWidget</extends>
   <header location="global">QtQuickWidgets/QQuickWidget</header>
  </customwidget>
 </customwidgets>
 <resources/>
 <connections/>
</ui>
main.cpp
#include "graphstest.h"
#include <QApplication>
int main(int argc, char *argv[])
{
	QApplication a(argc, argv);
	graphsTest w;
	w.show();
	return a.exec();
}
Qt 6.9.1 Mingw64 in windows 11:
Further more, how to add a rubber-band selection tool and connect QML signals to the C++ slots, is a bit hard for me . I'll try it later.
@goldenhawking You failed to clear QList<QPointF> data; at each time a new line is perpared!
if (evt->timerId() == m_timerEvent) { QDateTime dtmNow = QDateTime::currentDateTime(); const int N = m_lineSeries.size(); for (int n = 0; n < N; ++n) { QList<QPointF> data; //Here for (int i = 0; i < 30; ++i) { data << QPointF(dtmNow.addSecs(-3600 * 24.0 / 30 * (29 - i)).toMSecsSinceEpoch(), (rand() % 500 - 250) / 100.0 + n * 16 - 80); } m_lineSeries[n]->replace(data); } //... -
@goldenhawking You failed to clear QList<QPointF> data; at each time a new line is perpared!
if (evt->timerId() == m_timerEvent) { QDateTime dtmNow = QDateTime::currentDateTime(); const int N = m_lineSeries.size(); for (int n = 0; n < N; ++n) { QList<QPointF> data; //Here for (int i = 0; i < 30; ++i) { data << QPointF(dtmNow.addSecs(-3600 * 24.0 / 30 * (29 - i)).toMSecsSinceEpoch(), (rand() % 500 - 250) / 100.0 + n * 16 - 80); } m_lineSeries[n]->replace(data); } //...@BugSleeper said in Qt Graphs. Building 2d plot using c++ only.:
So you're talking to yourself now? Why two accounts?
Qt Online Installer direct download: https://download.qt.io/official_releases/online_installers/
Visit the Qt Academy at https://academy.qt.io/catalog -
@BugSleeper said in Qt Graphs. Building 2d plot using c++ only.:
So you're talking to yourself now? Why two accounts?
@Christian-Ehrlicher said in Qt Graphs. Building 2d plot using c++ only.:
ing to yourself now? Why two accounts?
I'm GH's student, We're using a same computer!
-
@Christian-Ehrlicher said in Qt Graphs. Building 2d plot using c++ only.:
ing to yourself now? Why two accounts?
I'm GH's student, We're using a same computer!
@BugSleeper said in Qt Graphs. Building 2d plot using c++ only.:
I'm GH's student, We're using a same computer!
This explains it. Thx.
We have a lot of really interesting spam in the last weeks so this was somewhat suspicious.Qt Online Installer direct download: https://download.qt.io/official_releases/online_installers/
Visit the Qt Academy at https://academy.qt.io/catalog -
@BugSleeper said in Qt Graphs. Building 2d plot using c++ only.:
I'm GH's student, We're using a same computer!
This explains it. Thx.
We have a lot of really interesting spam in the last weeks so this was somewhat suspicious.@everyone
Another question is , how to remove one line from current list in C++? Some App such as process monitor will frequently add or remove lines in the middle of current list. However, I notice that QML List operations can only add or remove objects from the end.
//qqmllist.h
    AppendFunction append = nullptr;
    CountFunction count = nullptr;
    AtFunction at = nullptr;
    ClearFunction clear = nullptr;
    ReplaceFunction replace = nullptr;
    RemoveLastFunction removeLast = nullptr;
At this moment, we can clear the graph, and re-add lines. But this is not a nice solution. May be a "removeAt" function or "removeOne" can be adopted for this usage in future.
There seems to be extra works for QScatterSeries and other classes from QtCharts to QtGraphs, new class has fewer functions and properties than old one. And, Will multi-Y Axises be supported in future ? For example, we can bind a line series to left axis in Kg or right axis in Meters.