
Qt Creator debugger is slow
-
I am using
Qt 6.1.3onWindows 10,Visual Studio 2019, andQt Creator 9.0.1.Googling for
Qt Creator slowgives me446,000 hits, with adverbs such asvery,really,extremely,painfully, etc. Most of these complaints are not very recent, but, surprisingly, nothing seems to have been done to solve this very painful problem.When investigating the problem, I found out that:
-
In
Qt Creator, if you selectEdit,Preferences..., then in the dialogPreferencesselectDebugger, tabCDB, and disableUse Python dumper, the slowness disappears. -
Unfortunatly, after disabling
Use Python dumper, the information displayed by the debugger is of course less useful. For example, instances ofQStringare displayed asclass QString, instances ofstd::vectorcannot be examined, etc. -
Directory
C:\Qt\Tools\QtCreator\share\qtcreator\debuggercontains several Python modules used by the Python dumper. -
In a specific scenario, after the debugger had stopped on a certain breakpoint, it took 15 seconds before the variables were shown on the
Localsview. After manually profiling the Python code, I found out that the Python dumper spent most of its time inC:\Qt\Tools\QtCreator\share\qtcreator\debugger\cdbbridge.py, in functionDumper.lookupNativeType(), for a variable of typestd::vector<size_t>&(Type(name="std::vector<unsigned __int64,std::allocator<unsigned __int64> >*",bsize=64,code=6)) which was empty. -
Dumper.lookupNativeType()callscdbext.lookupType(), but it seems that modulecdbextis only provided as a binary DLL (C:\Qt\Tools\QtCreator\lib\qtcreatorcdbext64\qtcreatorcdbext.dll), so I am not sure how to further investigate this issue.
Any idea is more than welcome.
PS: No, switching from Visual Studio 2019 to MinGW is not an option for us. Switching to Linux even less so.
-
-
I think the main bugreport that tracks this is https://bugreports.qt.io/browse/QTCREATORBUG-18287
Do you have a minimal project that reproduces the behavior? Feel free to upload it to the above bug report.
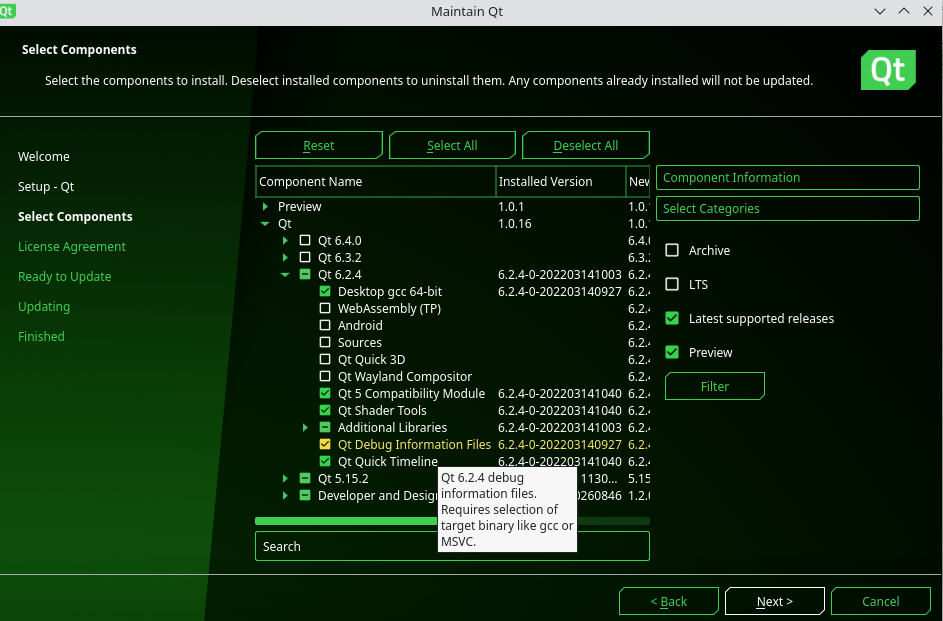
Also do you have the Qt Debug Information Files installed?
-
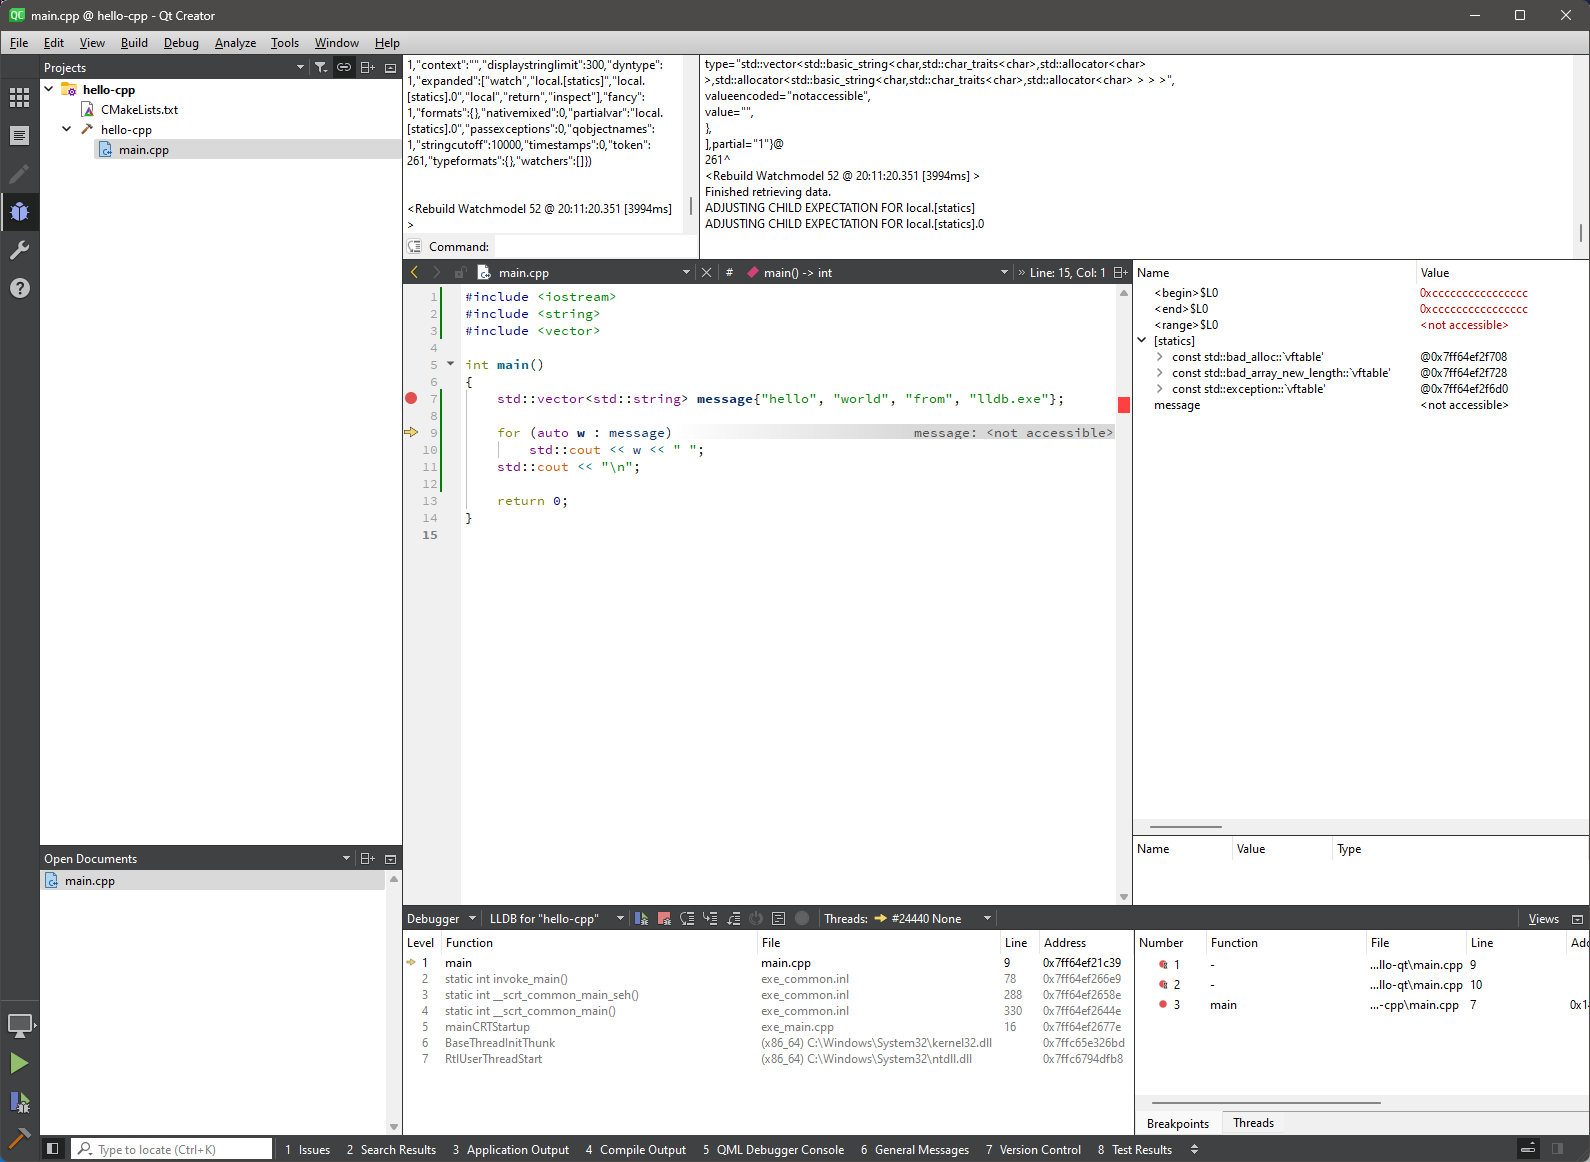
Another alternative would be to use LLVM's
lldb.exewith Visual C++'s PDB format.At QTCREATORBUG-28749: Use lldb.exe from LLVM package with Visual C++ compiler I've got a Hello World working, but only barely:
-
Hi,
thanks for the very detailed investigation.
This sounds like the python dumpers are trying to lookup a type that does not exist in the requested module (second parameter of cdbext.lookupType)...
But, also quickly checked whether I can reproduce the issue here. Neither breaking in a function with that type nor pasting a lookup command of that type resulted in the time you have reported here.
The command I used to check this was:!qtcreatorcdbext.script print(cdbext.lookupType('std::vector<unsigned __int64,std::allocator<unsigned __int64> >*',0).name())This can be pasted into the Command field of the Debugger Log which can be enabled under View -> Views 0> Debugger Log while in debug mode.
Additionally looking up pointer types should always take a shortcut and should just return fake type without looking symbols up in the debugger.
A common cause for slow debugging sessions is usually unused watchers since looking up those can take really long.
If you could share a minimal project that can reproduce the issue for you I can have a detailed look here. Also the content of the right hand side of the Debugger log can be helpful to share.
If you want to further investigate the issue on your side you would need to compile the cdbextension yourself (remember to link against a debug version of python) and set debugPyCdbextModule in <creatorsource>\src\libs\qtcreatorcdbext\pycdbextmodule.h to true (sorry, I have not implemented a buildsystem switch for this). And if that doesn't give you any usable information you might want to attach directly to the cdb and step through the individual functions.
-
As suggested by Cristian Adam, I just added a comment to https://bugreports.qt.io/browse/QTCREATORBUG-18287 My comment contains a minimal scenario which exhibits slowness (although not nearly as dramatic as in our real project).
I did not have watchers during my experiment. Only one single breakpoint.
-
Another alternative would be to use LLVM's
lldb.exewith Visual C++'s PDB format.At QTCREATORBUG-28749: Use lldb.exe from LLVM package with Visual C++ compiler I've got a Hello World working, but only barely:
@cristian-adam Excerpt from https://bugreports.qt.io/browse/QTCREATORBUG-28749:
- Unfortunately the pretty printes didn't work.
- A Qt application is crashing the debugger with:...
We are not too interested by such a setup.
-
I think the main bugreport that tracks this is https://bugreports.qt.io/browse/QTCREATORBUG-18287
Do you have a minimal project that reproduces the behavior? Feel free to upload it to the above bug report.
Also do you have the Qt Debug Information Files installed?
@cristian-adam See my comment in https://bugreports.qt.io/browse/QTCREATORBUG-18287
Yes, we did install "Qt Debug Information Files".
-
Hi,
thanks for the very detailed investigation.
This sounds like the python dumpers are trying to lookup a type that does not exist in the requested module (second parameter of cdbext.lookupType)...
But, also quickly checked whether I can reproduce the issue here. Neither breaking in a function with that type nor pasting a lookup command of that type resulted in the time you have reported here.
The command I used to check this was:!qtcreatorcdbext.script print(cdbext.lookupType('std::vector<unsigned __int64,std::allocator<unsigned __int64> >*',0).name())This can be pasted into the Command field of the Debugger Log which can be enabled under View -> Views 0> Debugger Log while in debug mode.
Additionally looking up pointer types should always take a shortcut and should just return fake type without looking symbols up in the debugger.
A common cause for slow debugging sessions is usually unused watchers since looking up those can take really long.
If you could share a minimal project that can reproduce the issue for you I can have a detailed look here. Also the content of the right hand side of the Debugger log can be helpful to share.
If you want to further investigate the issue on your side you would need to compile the cdbextension yourself (remember to link against a debug version of python) and set debugPyCdbextModule in <creatorsource>\src\libs\qtcreatorcdbext\pycdbextmodule.h to true (sorry, I have not implemented a buildsystem switch for this). And if that doesn't give you any usable information you might want to attach directly to the cdb and step through the individual functions.
@DavidSchulz Did you notice my comment in https://bugreports.qt.io/browse/QTCREATORBUG-18287 ? Are you able to reproduce?
-
@cristian-adam Excerpt from https://bugreports.qt.io/browse/QTCREATORBUG-28749:
- Unfortunately the pretty printes didn't work.
- A Qt application is crashing the debugger with:...
We are not too interested by such a setup.
@Antonius said in Qt Creator debugger is slow:
@cristian-adam Excerpt from https://bugreports.qt.io/browse/QTCREATORBUG-28749:
- Unfortunately the pretty printes didn't work.
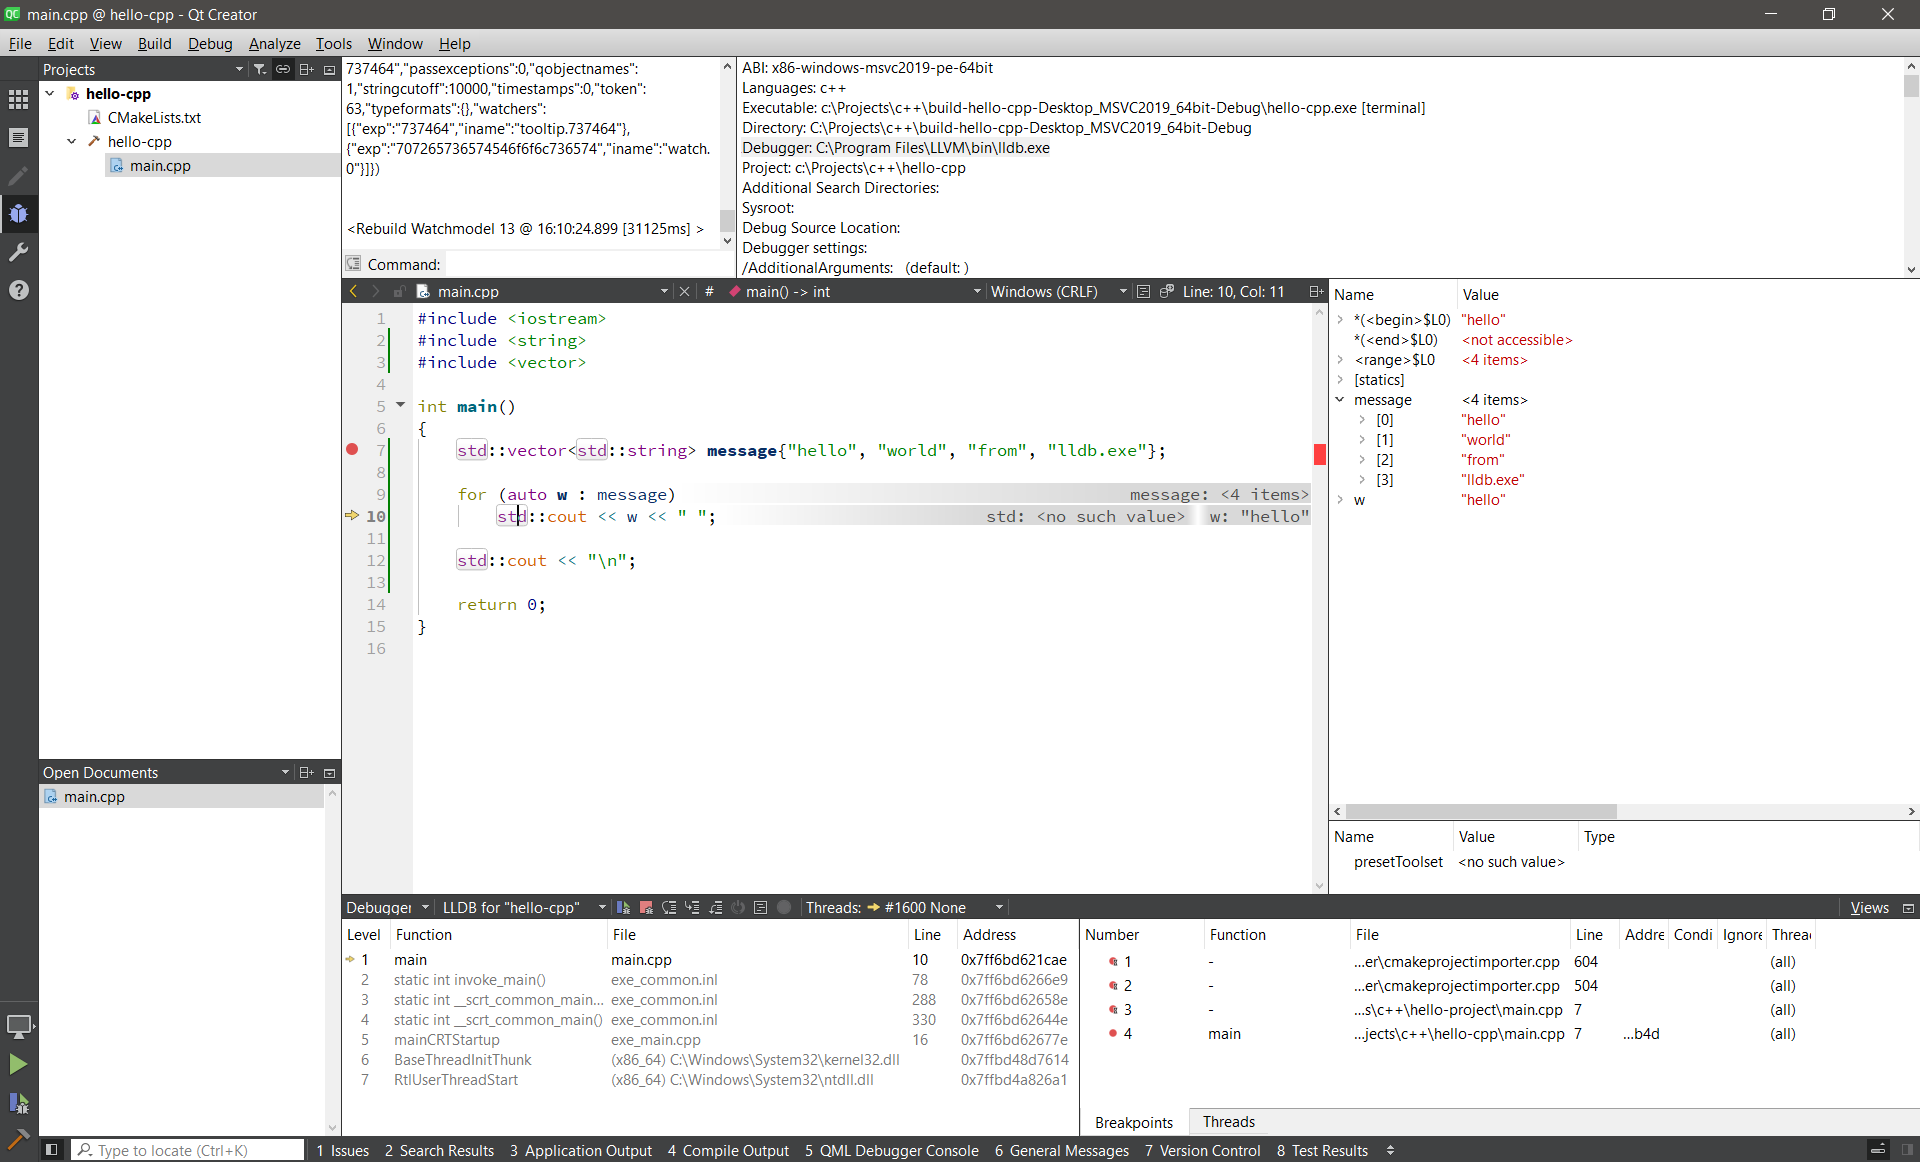
I've got the pretty printers to work with C++ standard types 🎉
- A Qt application is crashing the debugger with:...
This one is still a problem.
The good thing about
lldbis that it's open source and we could fix issues. Withcdb... it's a bit more complicated. -
@Antonius said in Qt Creator debugger is slow:
@cristian-adam Excerpt from https://bugreports.qt.io/browse/QTCREATORBUG-28749:
- Unfortunately the pretty printes didn't work.
I've got the pretty printers to work with C++ standard types 🎉
- A Qt application is crashing the debugger with:...
This one is still a problem.
The good thing about
lldbis that it's open source and we could fix issues. Withcdb... it's a bit more complicated.@cristian-adam Good that progress is being made with
lldb.Five days ago, I asked @DavidSchulz whether he is able to reproduce my slight delays with the minimal project he had asked for, and which I posted on https://bugreports.qt.io/browse/QTCREATORBUG-18287 I got no answer so far. Are you able to reproduce those delays?
-
Hi everyone,
I had this issue also (qt debugger really slow) and I realized that it was spending to much time setting the breakpoints. Therefore, while debugging, I was paying attention to the tab where the breakpoints arelisted and I realize that there were 7 or 8 breakpoints from a test project I used to work with (not any more, and nothing to do with the project I was currently working with). Do not ask me why they were there.
After deleteing all the breakpoints and just set the correct ones for my current project, the debugger was as fast as before.
I hope it helps at least someone.
@MiC78 said in Qt Creator debugger is slow:
Do not ask me why they were there.
If you just open up projects in QtCreator they are opened inside the default session. Sessions in Qt Creator never forget anything. In order to not carry over any breakpoints (or bookmarks) from other projects, create a new session for each project (and then later open the sessions and not the projects).