Skip to content
  • Categories
  • Recent
  • Tags
  • Popular
  • Users
  • Groups
  • Search
  • Get Qt Extensions
  • Unsolved
Collapse
Brand Logo
  1. Home
  2. Qt Development
  3. General and Desktop
  4. PointLables on series Hide under screen close to axis in QtCharts (c++)
Forum Updated to NodeBB v4.3 + New Features

PointLables on series Hide under screen close to axis in QtCharts (c++)

Scheduled Pinned Locked Moved Unsolved General and Desktop
qtchartsqt5c++
1 Posts 1 Posters 303 Views
  • Oldest to Newest
  • Newest to Oldest
  • Most Votes
Reply
  • Reply as topic
Log in to reply
This topic has been deleted. Only users with topic management privileges can see it.
  • U Offline
    U Offline
    Usama
    wrote on 1 Jun 2021, 09:18 last edited by Usama 6 Jan 2021, 13:58
    #1

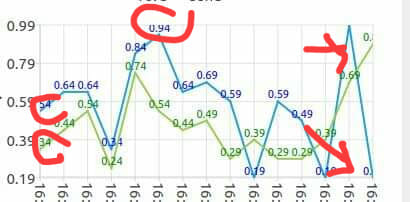
    Hi i am trying to make the following graph with the help of QtCharts but the problem i am facing is the pointlables hides under screen near axis.. The problematic portion is highlighted in picture.Picture

    1 Reply Last reply
    0

    1/1

    1 Jun 2021, 09:18

    • Login

    • Login or register to search.
    1 out of 1
    • First post
      1/1
      Last post
    0
    • Categories
    • Recent
    • Tags
    • Popular
    • Users
    • Groups
    • Search
    • Get Qt Extensions
    • Unsolved