Skip to content
  • Categories
  • Recent
  • Tags
  • Popular
  • Users
  • Groups
  • Search
  • Get Qt Extensions
  • Unsolved
Collapse
Brand Logo
  1. Home
  2. Qt Development
  3. General and Desktop
  4. Plot: Heat Map using Qt
Qt 6.11 is out! See what's new in the release blog

Plot: Heat Map using Qt

Scheduled Pinned Locked Moved Unsolved General and Desktop
16 Posts 7 Posters 12.4k Views 5 Watching
  • Oldest to Newest
  • Newest to Oldest
  • Most Votes
Reply
  • Reply as topic
Log in to reply
This topic has been deleted. Only users with topic management privileges can see it.
  • F fem_dev

    @beecksche thank you!

    Well, now I saw 2 Qt possibilities:

    • Option A: Using Qt3DSurface and "freeze" the z axis (example here)
      79b0426b-2975-4bcc-858c-af54662aa796-image.png

    • Option B: Using QML (example here)

    567e9cd5-0c33-4fe8-90dc-1580a73c6f37-image.png

    I opened the 3DSurface example described above using Qt Creator IDE and ran it.
    It opens ok, but I have no rotation interaction. So I just have the selection and the zoom mouse interaction.
    I read th Qt documentation (link here) and it said that:

    End users can interact with the rendered graph by using either the mouse or touch to rotate, zoom, or select data. 
    Graphs can be rotated freely by holding down the right mouse button and moving the mouse.
    

    In this example source-code I didn't found any references to the setRotationEnabled(bool enable) (described here)

    QUESTIONS
    a) What I have to do to get the rotation interaction working in this Qt3DSurface example?
    b) In the Qt3DSurface example, how can I set the graph start position to a view from top to down, to user see only X and Y axis (no z axis)?

    beeckscheB Offline
    beeckscheB Offline
    beecksche
    wrote on last edited by
    #7

    @fem_dev

    For the camera preset have a look here. I would also enable the ortho projection.

    You can also disable the selection mode.

    F 1 Reply Last reply
    2
    • beeckscheB beecksche

      @fem_dev

      For the camera preset have a look here. I would also enable the ortho projection.

      You can also disable the selection mode.

      F Offline
      F Offline
      fem_dev
      wrote on last edited by
      #8

      @beecksche thank you for your help...

      I don't know how to apply this setCameraPreset(Q3DCamera::CameraPreset preset) because, in this Qt3Surface example the surface variable doesn't have this setCameraPreset() method.

      How can I do that?

      beeckscheB 1 Reply Last reply
      0
      • F fem_dev

        @beecksche thank you for your help...

        I don't know how to apply this setCameraPreset(Q3DCamera::CameraPreset preset) because, in this Qt3Surface example the surface variable doesn't have this setCameraPreset() method.

        How can I do that?

        beeckscheB Offline
        beeckscheB Offline
        beecksche
        wrote on last edited by beecksche
        #9

        @fem_dev

        The function is part of the camera of the current scene:

        Q3DSurface *surface;
        surface->scene()->activeCamera()->setCameraPreset()
        

        https://doc.qt.io/qt-5/qtdatavisualization-scatter-example.html#setting-up-the-graph

        F 1 Reply Last reply
        2
        • beeckscheB beecksche

          @fem_dev

          The function is part of the camera of the current scene:

          Q3DSurface *surface;
          surface->scene()->activeCamera()->setCameraPreset()
          

          https://doc.qt.io/qt-5/qtdatavisualization-scatter-example.html#setting-up-the-graph

          F Offline
          F Offline
          fem_dev
          wrote on last edited by
          #10

          @beecksche perfect! It works great! Thank you!

          Could you please help me a little bit more?
          In this post above, I said that:

          @fem_dev said in Plot: Heat Map using Qt:

          I read th Qt documentation (link here) and it said that:
          End users can interact with the rendered graph by using either the mouse or touch to rotate, zoom, or select data.
          Graphs can be rotated freely by holding down the right mouse button and moving the mouse.

          In this example source-code I didn't found any references to the setRotationEnabled(bool enable) (described here)

          QUESTION:
          a) What I have to do to get the rotation interaction working in this Qt3DSurface example?

          F 1 Reply Last reply
          0
          • F fem_dev

            @beecksche perfect! It works great! Thank you!

            Could you please help me a little bit more?
            In this post above, I said that:

            @fem_dev said in Plot: Heat Map using Qt:

            I read th Qt documentation (link here) and it said that:
            End users can interact with the rendered graph by using either the mouse or touch to rotate, zoom, or select data.
            Graphs can be rotated freely by holding down the right mouse button and moving the mouse.

            In this example source-code I didn't found any references to the setRotationEnabled(bool enable) (described here)

            QUESTION:
            a) What I have to do to get the rotation interaction working in this Qt3DSurface example?

            F Offline
            F Offline
            fem_dev
            wrote on last edited by
            #11

            @fem_dev I got it! Is a right-click event! Thank you all!

            1 Reply Last reply
            0
            • F Offline
              F Offline
              fem_dev
              wrote on last edited by fem_dev
              #12

              To finish my questions ins this post, I would like to compare the Qt3DSurface graphical result and my target graphical result:

              If I open the Qt 3DSurface example and use this:

              m_graph->scene()->activeCamera()->setCameraPreset(Q3DCamera::CameraPresetDirectlyAbove)
              

              and change the line:

              m_sqrtSinSeries->setDrawMode(QSurface3DSeries::DrawSurfaceAndWireframe);
              

              to:

              m_sqrtSinSeries->setDrawMode(QSurface3DSeries::DrawSurface);
              

              I got this graph output:

              795da9a1-1e2f-4fe6-b708-6d127c942dd6-image.png

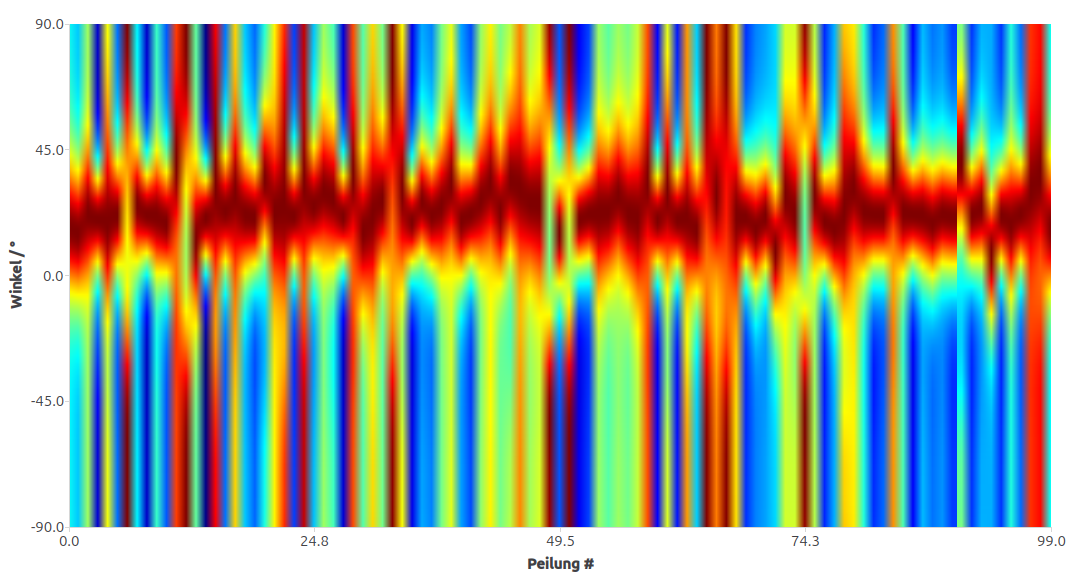
              My "target image style" is:
              5a6bfdb4-ce4c-4fd7-9826-b10bf2a44049-image.png

              So, in the 3DSurface example the image appears divided in triangles, where each triangle have a different color. Because of this method, the final image result IS NOT so "well defined" (color smooth transition) and doesn't have a "high resolution appearance" like the "target image style" above.

              a) Is there a way to get the same "well defined pixel resolution" using Q3DSurface?
              b) The "target image" have a right-side color pallet. How can I do that in Qt using Q3DSurface?

              1 Reply Last reply
              0
              • T Offline
                T Offline
                Trap
                wrote on last edited by
                #13

                Hi,

                I have added a Qt implementation of the HeatMap that you can find in this repo.

                Best regards,
                Ahmed Trabelsi

                SGaistS 1 Reply Last reply
                3
                • T Trap

                  Hi,

                  I have added a Qt implementation of the HeatMap that you can find in this repo.

                  Best regards,
                  Ahmed Trabelsi

                  SGaistS Offline
                  SGaistS Offline
                  SGaist
                  Lifetime Qt Champion
                  wrote on last edited by
                  #14

                  @Trap hi and welcome to devnet,

                  Thanks for the class !

                  There are some small improvements you can do to it.

                  Technically, you do not need to keep your QImage nor QPixmap as member variables since you will replace them with new ones when changing the data.

                  This will also remove the current memory leak you have with imageD. There's usually no need to allocate them on the heap.

                  Interested in AI ? www.idiap.ch
                  Please read the Qt Code of Conduct - https://forum.qt.io/topic/113070/qt-code-of-conduct

                  1 Reply Last reply
                  1
                  • __mk___ Offline
                    __mk___ Offline
                    __mk__
                    wrote last edited by
                    #15

                    5 years have passed and Qt still doesn't natively support heatmaps in QCharts.

                    There are some decent solutions in this thread, but I wasn't happy with either of them.
                    I've created a minimal, self contained heatmap method in case anyone needs it:

                    https://gist.github.com/mathklk/f1d8d0c5a82a84a637a260edfc76a145

                    grafik.png

                    1 Reply Last reply
                    1
                    • Joe von HabsburgJ Offline
                      Joe von HabsburgJ Offline
                      Joe von Habsburg
                      wrote last edited by
                      #16

                      You can use Qwt. I agree with you. QCharts so low.

                      1 Reply Last reply
                      0

                      • Login

                      • Login or register to search.
                      • First post
                        Last post
                      0
                      • Categories
                      • Recent
                      • Tags
                      • Popular
                      • Users
                      • Groups
                      • Search
                      • Get Qt Extensions
                      • Unsolved